Claude
Port's Claude integration allows you to ingest Claude API usage metrics into your software catalog using the Ocean Custom Integration framework.
Supported metrics
The Claude integration can ingest usage metrics from the Anthropic Admin API into Port:
Available for all Claude organizations:
claude_usage_record- Organization-level usage metrics from/v1/organizations/usage_report/messagesincluding token consumption (input/output/cache), request counts, and detailed breakdowns by workspace, model, service tier, context window, and API key.claude_cost_record- Cost tracking from/v1/organizations/cost_reportfor monitoring organizational spending.claude_workspace_usage- Workspace-level usage metrics when grouping byworkspace_id.claude_model_usage- Model-level usage metrics when grouping bymodel.claude_code_analytics- Claude Code usage metrics from/v1/organizations/usage_report/claude_codeincluding sessions, lines of code edited, commits, and pull requests (requires Claude Code access).
The Anthropic Admin API does not currently support grouping usage data by user (user_id). User-level analytics are not available through these endpoints. If you need user-level insights, consider using Claude Code analytics or other internal telemetry sources.
Prerequisites
To use this integration, you need:
- An Anthropic Admin API generated from the Admin section of the Anthropic Console.
- The API key should have permissions to read usage data and billing information.
Installation
Choose one of the following installation methods to deploy the Ocean Custom Integration:
- Helm
- Docker
Prerequisites
To install the integration, you need a Kubernetes cluster that the integration's container chart will be deployed to.
Please make sure that you have kubectl and helm installed on your machine, and that your kubectl CLI is connected to the Kubernetes cluster where you plan to install the integration.
If you are having trouble installing this integration, please refer to these troubleshooting steps.
Installation
- Add Port's Helm repo and install the Ocean Custom Integration:
Remember to replace the placeholders for YOUR_PORT_CLIENT_ID, YOUR_PORT_CLIENT_SECRET, and YOUR_ANTHROPIC_API_KEY.
helm repo add --force-update port-labs https://port-labs.github.io/helm-charts
helm upgrade --install my-ocean-claude-integration port-labs/port-ocean \
  --set port.clientId="YOUR_PORT_CLIENT_ID" \
  --set port.clientSecret="YOUR_PORT_CLIENT_SECRET" \
  --set port.baseUrl="https://api.getport.io" \
  --set initializePortResources=true \
  --set scheduledResyncInterval=120 \
  --set integration.identifier="my-ocean-claude-integration" \
  --set integration.type="custom" \
  --set integration.eventListener.type="POLLING" \
  --set integration.config.baseUrl="https://api.anthropic.com" \
  --set integration.config.authType="bearer" \
  --set integration.config.paginationType="none" \
  --set integration.secrets.token="YOUR_ANTHROPIC_API_KEY"
The port_region, port.baseUrl, portBaseUrl, port_base_url and OCEAN__PORT__BASE_URL parameters are used to select which instance of Port API will be used.
Port exposes two API instances, one for the EU region of Port, and one for the US region of Port.
- If you use the EU region of Port (https://app.port.io), your API URL is
https://api.port.io. - If you use the US region of Port (https://app.us.port.io), your API URL is
https://api.us.port.io.
Configuration parameters
This table summarizes the available parameters for the installation.
| Parameter | Description | Example | Required |
|---|---|---|---|
port.clientId | Your Port client id | ✅ | |
port.clientSecret | Your Port client secret | ✅ | |
port.baseUrl | Your Port API URL - https://api.getport.io for EU, https://api.us.getport.io for US | ✅ | |
integration.config.baseUrl | The base URL of the Anthropic API instance | https://api.anthropic.com | ✅ |
integration.config.authType | The authentication type for the API (use bearer for Anthropic) | bearer | ✅ |
integration.secrets.token | Your Anthropic Console API key | sk-ant-api03-...xxxxxxxxx | ✅ |
integration.config.paginationType | How your API handles pagination (offset, page, cursor, or none) | none | ❌ |
integration.eventListener.type | The event listener type. Read more about event listeners | POLLING | ✅ |
integration.type | The integration type (must be custom for Ocean Custom Integration) | custom | ✅ |
integration.identifier | Unique identifier for the integration instance | my-ocean-claude-integration | ✅ |
scheduledResyncInterval | The number of minutes between each resync. When not set the integration will resync for each event listener resync event. Read more about scheduledResyncInterval | 120 | ❌ |
initializePortResources | Default true, When set to true the integration will create default blueprints and the port App config Mapping. Read more about initializePortResources | true | ❌ |
sendRawDataExamples | Enable sending raw data examples from the third party API to port for testing and managing the integration mapping. Default is true | true | ❌ |
For advanced configuration such as proxies or self-signed certificates, click here.
To run the integration using Docker for a one-time sync:
Remember to replace the placeholders for YOUR_PORT_CLIENT_ID, YOUR_PORT_CLIENT_SECRET, and YOUR_ANTHROPIC_API_KEY.
docker run -i --rm --platform=linux/amd64 \
  -e OCEAN__EVENT_LISTENER='{"type":"ONCE"}' \
  -e OCEAN__INITIALIZE_PORT_RESOURCES=true \
  -e OCEAN__SEND_RAW_DATA_EXAMPLES=true \
  -e OCEAN__INTEGRATION__CONFIG__BASE_URL="https://api.anthropic.com" \
  -e OCEAN__INTEGRATION__CONFIG__AUTH_TYPE="bearer" \
  -e OCEAN__INTEGRATION__CONFIG__PAGINATION_TYPE="none" \
  -e OCEAN__INTEGRATION__SECRETS__TOKEN="YOUR_ANTHROPIC_API_KEY" \
  -e OCEAN__PORT__CLIENT_ID="YOUR_PORT_CLIENT_ID" \
  -e OCEAN__PORT__CLIENT_SECRET="YOUR_PORT_CLIENT_SECRET" \
  -e OCEAN__PORT__BASE_URL="https://api.getport.io" \
  ghcr.io/port-labs/port-ocean-custom:latest
The port_region, port.baseUrl, portBaseUrl, port_base_url and OCEAN__PORT__BASE_URL parameters are used to select which instance of Port API will be used.
Port exposes two API instances, one for the EU region of Port, and one for the US region of Port.
- If you use the EU region of Port (https://app.port.io), your API URL is
https://api.port.io. - If you use the US region of Port (https://app.us.port.io), your API URL is
https://api.us.port.io.
For advanced configuration such as proxies or self-signed certificates, click here.
Set up data model
Before the integration can sync data, you need to create the required blueprints in Port. These blueprints define the data model for your Claude metrics.
To create the blueprints:
-
Go to your Builder page.
-
Click on the
+ Blueprintbutton. -
Copy and paste each blueprint JSON from the sections below.
Claude Usage Record Blueprint (Click to expand)
Organization-level daily usage metrics:
{
  "identifier": "claude_usage_record",
  "description": "A daily summary record of Claude API usage for an organization",
  "title": "Claude Usage Record",
  "icon": "Anthropic",
  "schema": {
    "properties": {
      "record_date": {
        "type": "string",
        "format": "date-time",
        "title": "Record Date (UTC)"
        },
      "organization_id": {
        "type": "string",
        "title": "Organization ID"
        },
      "organization_name": {
        "type": "string",
        "title": "Organization Name"
        },
      "total_requests": {
        "type": "number",
        "title": "Total Requests"
        },
      "successful_requests": {
        "type": "number",
        "title": "Successful Requests"
        },
      "failed_requests": {
        "type": "number",
        "title": "Failed Requests"
        },
      "total_input_tokens": {
        "type": "number",
        "title": "Total Input Tokens"
        },
      "total_output_tokens": {
        "type": "number",
        "title": "Total Output Tokens"
        },
      "total_cache_read_tokens": {
        "type": "number",
        "title": "Total Cache Read Tokens"
        },
      "total_cache_write_tokens": {
        "type": "number",
        "title": "Total Cache Write Tokens"
        },
      "total_cost_usd": {
        "type": "number",
        "title": "Total Cost (USD)"
        },
      "most_used_model": {
        "type": "string",
        "title": "Most Used Model"
        },
      "model_breakdown": {
        "type": "object",
        "title": "Model Usage Breakdown"
        },
      "active_api_keys": {
        "type": "number",
        "title": "Active API Keys"
        }
    },
    "required": ["record_date", "organization_id"]
  },
  "mirrorProperties": {},
  "calculationProperties": {
    "success_rate": {
      "title": "Success Rate",
      "description": "Percentage of successful API requests",
      "calculation": "if .properties.total_requests > 0 then (.properties.successful_requests / .properties.total_requests) * 100 else 0 end",
      "type": "number",
      "colorized": true,
      "colors": {
        "80": "red",
        "90": "orange",
        "95": "yellow",
        "98": "green"
      }
    },
    "total_tokens": {
      "title": "Total Tokens",
      "description": "Sum of input and output tokens",
      "calculation": ".properties.total_input_tokens + .properties.total_output_tokens",
      "type": "number"
    }
  },
  "aggregationProperties": {},
  "relations": {}
}
Claude Cost Record Blueprint (Click to expand)
Cost tracking for organizational spending:
{
  "identifier": "claude_cost_record",
  "description": "Daily cost tracking for Claude API usage",
  "title": "Claude Cost Record",
  "icon": "Anthropic",
  "schema": {
    "properties": {
      "record_date": {
        "type": "string",
        "format": "date-time",
        "title": "Record Date (UTC)"
      },
      "organization_id": {
        "type": "string",
        "title": "Organization ID"
      },
      "organization_name": {
        "type": "string",
        "title": "Organization Name"
      },
      "total_cost_usd": {
        "type": "number",
        "title": "Total Cost (USD)"
      },
      "cost_breakdown": {
        "type": "object",
        "title": "Cost Breakdown"
      }
    },
    "required": [
      "record_date",
      "organization_id"
    ]
  },
  "mirrorProperties": {},
  "calculationProperties": {},
  "aggregationProperties": {},
  "relations": {}
}
Claude Workspace Usage Blueprint (Click to expand)
Workspace-level usage metrics:
{
  "identifier": "claude_workspace_usage",
  "description": "Usage metrics broken down by workspace",
  "title": "Claude Workspace Usage",
  "icon": "Anthropic",
  "schema": {
    "properties": {
      "record_date": {
        "type": "string",
        "format": "date-time",
        "title": "Record Date (UTC)"
      },
      "organization_id": {
        "type": "string",
        "title": "Organization ID"
      },
      "workspace_id": {
        "type": "string",
        "title": "Workspace ID"
      },
      "workspace_name": {
        "type": "string",
        "title": "Workspace Name"
      },
      "total_requests": {
        "type": "number",
        "title": "Total Requests"
      },
      "successful_requests": {
        "type": "number",
        "title": "Successful Requests"
      },
      "failed_requests": {
        "type": "number",
        "title": "Failed Requests"
      },
      "input_tokens": {
        "type": "number",
        "title": "Input Tokens"
      },
      "output_tokens": {
        "type": "number",
        "title": "Output Tokens"
      },
      "cache_read_tokens": {
        "type": "number",
        "title": "Cache Read Tokens"
      },
      "cache_write_tokens": {
        "type": "number",
        "title": "Cache Write Tokens"
      },
      "cost_usd": {
        "type": "number",
        "title": "Cost (USD)"
      }
    },
    "required": [
      "record_date",
      "organization_id",
      "workspace_id"
    ]
  },
  "mirrorProperties": {},
  "calculationProperties": {
    "success_rate": {
      "title": "Success Rate",
      "calculation": "if .properties.total_requests > 0 then (.properties.successful_requests / .properties.total_requests) * 100 else 0 end",
      "type": "number",
      "colorized": true,
      "colors": {
        "80": "red",
        "90": "orange",
        "95": "yellow",
        "98": "green"
      }
    },
    "total_tokens": {
      "title": "Total Tokens",
      "calculation": ".properties.input_tokens + .properties.output_tokens",
      "type": "number"
    }
  },
  "aggregationProperties": {},
  "relations": {}
}
Claude Model Usage Blueprint (Click to expand)
Model-level usage statistics:
{
  "identifier": "claude_model_usage",
  "description": "Usage metrics broken down by Claude model type",
  "title": "Claude Model Usage",
  "icon": "Anthropic",
  "schema": {
    "properties": {
      "record_date": {
        "type": "string",
        "format": "date-time",
        "title": "Record Date (UTC)"
      },
      "organization_id": {
        "type": "string",
        "title": "Organization ID"
      },
      "model_name": {
        "type": "string",
        "title": "Model Name"
      },
      "model_id": {
        "type": "string",
        "title": "Model ID"
      },
      "total_requests": {
        "type": "number",
        "title": "Total Requests"
      },
      "successful_requests": {
        "type": "number",
        "title": "Successful Requests"
      },
      "failed_requests": {
        "type": "number",
        "title": "Failed Requests"
      },
      "input_tokens": {
        "type": "number",
        "title": "Input Tokens"
      },
      "output_tokens": {
        "type": "number",
        "title": "Output Tokens"
      },
      "cache_read_tokens": {
        "type": "number",
        "title": "Cache Read Tokens"
      },
      "cache_write_tokens": {
        "type": "number",
        "title": "Cache Write Tokens"
      },
      "cost_usd": {
        "type": "number",
        "title": "Cost (USD)"
      }
    },
    "required": [
      "record_date",
      "organization_id",
      "model_name"
    ]
  },
  "mirrorProperties": {},
  "calculationProperties": {
    "success_rate": {
      "title": "Success Rate",
      "calculation": "if .properties.total_requests > 0 then (.properties.successful_requests / .properties.total_requests) * 100 else 0 end",
      "type": "number",
      "colorized": true,
      "colors": {
        "80": "red",
        "90": "orange",
        "95": "yellow",
        "98": "green"
      }
    },
    "total_tokens": {
      "title": "Total Tokens",
      "calculation": ".properties.input_tokens + .properties.output_tokens",
      "type": "number"
    },
    "average_tokens_per_request": {
      "title": "Avg Tokens/Request",
      "calculation": "if .properties.total_requests > 0 then ((.properties.input_tokens + .properties.output_tokens) / .properties.total_requests) else 0 end",
      "type": "number"
    }
  },
  "aggregationProperties": {},
  "relations": {}
}
Claude Code analytics Blueprint (Click to expand)
Claude Code usage metrics for tracking development activity:
{
  "identifier": "claude_code_analytics",
  "description": "Daily Claude Code usage metrics including sessions, lines of code, commits, and PRs",
  "title": "Claude Code Analytics",
  "icon": "Anthropic",
  "schema": {
    "properties": {
      "record_date": {
        "type": "string",
        "format": "date-time",
        "title": "Record Date (UTC)"
      },
      "organization_id": {
        "type": "string",
        "title": "Organization ID"
      },
      "organization_name": {
        "type": "string",
        "title": "Organization Name"
      },
      "total_sessions": {
        "type": "number",
        "title": "Total Sessions"
      },
      "total_lines_edited": {
        "type": "number",
        "title": "Total Lines Edited"
      },
      "total_commits": {
        "type": "number",
        "title": "Total Commits"
      },
      "total_pull_requests": {
        "type": "number",
        "title": "Total Pull Requests"
      },
      "active_users": {
        "type": "number",
        "title": "Active Users"
      },
      "breakdown": {
        "type": "object",
        "title": "Usage Breakdown"
      }
    },
    "required": [
      "record_date",
      "organization_id"
    ]
  },
  "mirrorProperties": {},
  "calculationProperties": {
    "avg_lines_per_session": {
      "title": "Avg Lines/Session",
      "calculation": "if .properties.total_sessions > 0 then (.properties.total_lines_edited / .properties.total_sessions) else 0 end",
      "type": "number"
    },
    "avg_commits_per_user": {
      "title": "Avg Commits/User",
      "calculation": "if .properties.active_users > 0 then (.properties.total_commits / .properties.active_users) else 0 end",
      "type": "number"
    }
  },
  "aggregationProperties": {},
  "relations": {}
} -
Click
Saveto save the blueprint.
Configuration
After installation, define which endpoints to sync in your integration configuration. Each resource maps an API endpoint to Port entities using JQ expressions to transform the data.
Key mapping components:
kind: The API endpoint path (combined with your base URL).selector.query: JQ filter to include/exclude entities (use'true'to sync all).selector.data_path: JQ expression pointing to the array of items in the response.port.entity.mappings: How to map API fields to Port entity properties.
For more details on how the Ocean Custom Integration works, see the How it works section in the custom integration overview.
To configure the mappings:
Before adding resources, configure the following static HTTP headers on the integration so every request includes them:
anthropic-version: 2023-06-01anthropic-beta: admin-1
You can set headers from the Ocean integration UI (Advanced settings → Headers) or by providing them via Helm/Docker values.
-
Go to your data sources page.
-
Find your Claude integration in the list.
-
Click on the integration to open the mapping editor.
-
Add the resource mapping configurations below.
Organization usage metrics mapping (Click to expand)
This endpoint provides detailed usage metrics including token consumption and request counts:
resources:
  - kind: /v1/organizations/usage_report/messages
    selector:
      query: 'true'
      data_path: '.data[].results[]'
      query_params:
        starting_at: '((now | floor) - (86400 * 30)) | strftime("%Y-%m-%dT00:00:00Z")'
        ending_at: '(now | floor) | strftime("%Y-%m-%dT00:00:00Z")'
        bucket_width: "1d"
    port:
      entity:
        mappings:
          identifier: '((.date // .starting_at // "unknown") | tostring) + "@org"'
          title: '"Claude Usage - " + ((.date // .starting_at // "unknown") | tostring)'
          blueprint: '"claude_usage_record"'
          properties:
            record_date: (.date // .starting_at // "")
            organization_id: .organization_id // ""
            organization_name: .organization_name // ""
            total_requests: .requests // 0
            successful_requests: .successful_requests // 0
            failed_requests: (.failed_requests // 0)
            total_input_tokens: .input_tokens // 0
            total_output_tokens: .output_tokens // 0
            total_cache_read_tokens: .cache_read_input_tokens // 0
            total_cache_write_tokens: .cache_write_input_tokens // 0
            total_cost_usd: .cost_usd // 0
            model_breakdown: .model_breakdown // {}
Response structureThe API returns data in buckets. Each bucket has
starting_at,ending_at, and aresults[]array. When usingdata_path: '.data[].results[]', you'll iterate over all results from all buckets. The actual field names in the results may vary - adjust the property mappings based on your actual API response.Pagination: The API supports pagination via
has_moreandnext_pagefields. For large date ranges, you may need to handle pagination by using thenext_pagetoken in subsequent requests.Cost report mapping (Click to expand)
This endpoint provides cost data for monitoring organizational spending:
resources:
  - kind: /v1/organizations/cost_report
    selector:
      query: 'true'
      data_path: '.data[].results[]'
      query_params:
        starting_at: '((now | floor) - (86400 * 30)) | strftime("%Y-%m-%dT00:00:00Z")'
        ending_at: '(now | floor) | strftime("%Y-%m-%dT00:00:00Z")'
        bucket_width: "1d"
    port:
      entity:
        mappings:
          identifier: '((.date // .starting_at // "unknown") | tostring) + "@org"'
          title: '"Claude Cost - " + ((.date // .starting_at // "unknown") | tostring)'
          blueprint: '"claude_cost_record"'
          properties:
            record_date: (.starting_at // .date)
            organization_id: .organization_id // ""
            organization_name: .organization_name // ""
            total_cost_usd: .cost_usd // 0
            cost_breakdown: .cost_breakdown // {}
Workspace-level usage metrics mapping (Click to expand)
Track usage metrics at the workspace level by grouping the usage report by
workspace_id:resources:
- kind: /v1/organizations/usage_report/messages
selector:
query: 'true'
query_params:
starting_at: '((now | floor) - (86400 * 30)) | strftime("%Y-%m-%dT00:00:00Z")'
ending_at: '(now | floor) | strftime("%Y-%m-%dT00:00:00Z")'
bucket_width: "1d"
'group_by[]': "workspace_id"
data_path: '.data[].results[]'
port:
entity:
mappings:
identifier: .workspace_id + "@" + ((.date // .starting_at // "unknown") | tostring)
title: (.workspace_name // .workspace_id) + " - " + ((.date // .starting_at // "unknown") | tostring)
blueprint: '"claude_workspace_usage"'
properties:
record_date: (.starting_at // .date)
organization_id: .organization_id // ""
workspace_id: .workspace_id
workspace_name: .workspace_name // ""
total_requests: .requests // 0
successful_requests: .successful_requests // 0
failed_requests: .failed_requests // 0
input_tokens: .input_tokens // 0
output_tokens: .output_tokens // 0
cache_read_tokens: .cache_read_input_tokens // 0
cache_write_tokens: .cache_write_input_tokens // 0
cost_usd: .cost_usd // 0Model-level usage metrics mapping (Click to expand)
Track usage metrics at the model level by grouping the usage report by
model_id:resources:
- kind: /v1/organizations/usage_report/messages
selector:
query: 'true'
query_params:
starting_at: '((now | floor) - (86400 * 30)) | strftime("%Y-%m-%dT00:00:00Z")'
ending_at: '(now | floor) | strftime("%Y-%m-%dT00:00:00Z")'
bucket_width: "1d"
'group_by[]': "model"
data_path: '.data[].results[]'
port:
entity:
mappings:
identifier: .model + "@" + ((.date // .starting_at // "unknown") | tostring)
title: .model + " usage - " + ((.date // .starting_at // "unknown") | tostring)
blueprint: '"claude_model_usage"'
properties:
record_date: (.starting_at // .date)
organization_id: .organization_id // ""
model_name: .model
model_id: .model
total_requests: .requests // 0
successful_requests: .successful_requests // 0
failed_requests: .failed_requests // 0
input_tokens: .input_tokens // 0
output_tokens: .output_tokens // 0
cache_read_tokens: .cache_read_input_tokens // 0
cache_write_tokens: .cache_write_input_tokens // 0
cost_usd: .cost_usd // 0Claude Code analytics mapping (Click to expand)
Track Claude Code usage metrics including sessions, lines of code, commits, and pull requests:
Requires Claude Code accessThis endpoint requires access to Claude Code. You'll receive an error if your organization doesn't have Claude Code enabled.
resources:
  - kind: /v1/organizations/usage_report/claude_code
    selector:
      query: 'true'
      data_path: '.data[]'
      query_params:
        starting_at: '((now | floor) - (86400 * 30)) | strftime("%Y-%m-%d")'
    port:
      entity:
        mappings:
          identifier: .organization_id + "@code@" + (.date // .starting_at)
          title: "Claude Code Analytics - " + (.date // .starting_at)
          blueprint: '"claude_code_analytics"'
          properties:
            record_date: (.date // .starting_at)
            organization_id: .organization_id // ""
            organization_name: .organization_name // ""
            total_sessions: .sessions // 0
            total_lines_edited: .lines_of_code_edited // 0
            total_commits: .commits // 0
            total_pull_requests: .pull_requests // 0
            active_users: .active_users // 0
breakdown: .breakdown // {} -
Click
Saveto save the mapping.
Customization
If you want to customize your setup or test different API endpoints before committing to a configuration, use the interactive builder.
The interactive builder helps you:
- Test your Claude API endpoints with live data.
- Automatically detect the data structure and field types.
- Generate blueprints and resource mappings tailored to your preferences.
- Get installation commands with your configuration pre-filled.
Simply provide your Anthropic API details, and the builder will generate everything you need to install and create the integration in Port.
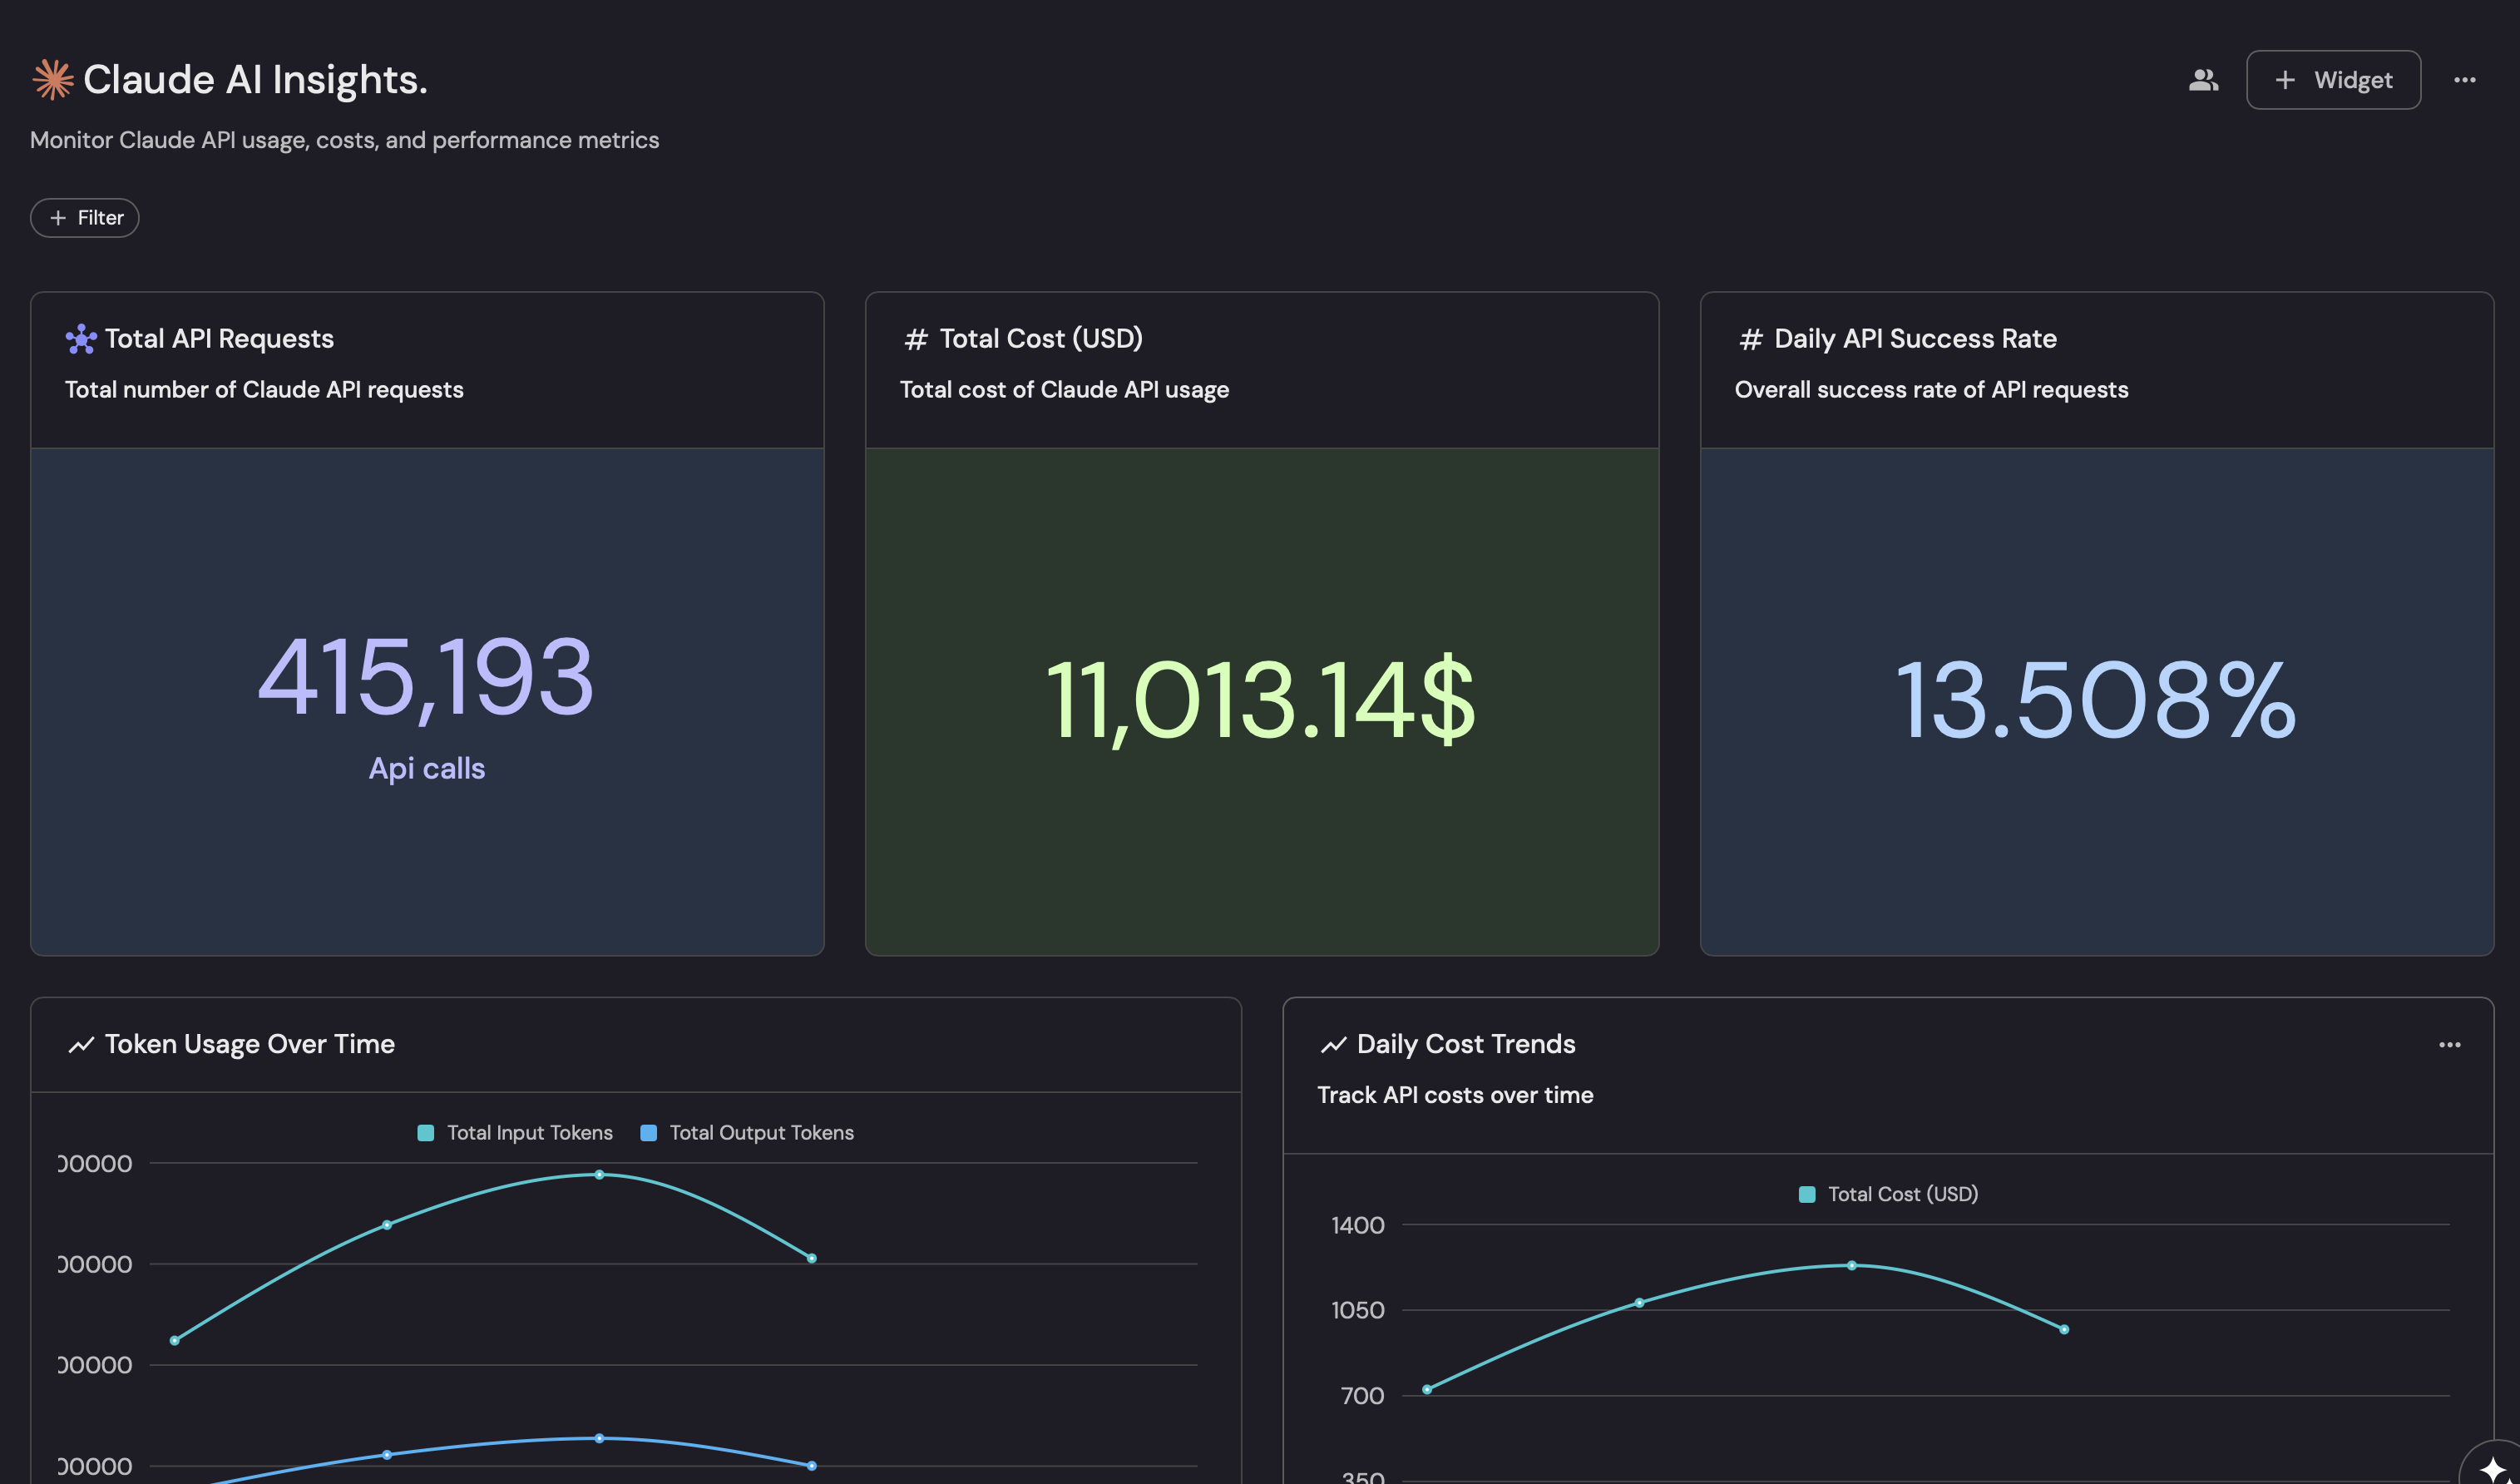
Visualize Claude metrics
Once your Claude data is synced to Port, you can create dashboards to monitor API usage, track costs, analyze model performance, and measure workspace-level metrics. This section shows you how to build insightful visualizations using Port's dashboard widgets.
Create a dashboard
-
Navigate to your software catalog.
-
Click on the
+ Newbutton in the left sidebar. -
Select New dashboard.
-
Name the dashboard Claude AI Insights.
-
Input
Monitor Claude API usage, costs, and performance metricsunder Description. -
Select the
Anthropicicon. -
Click
Create.
You now have a blank dashboard where you can add widgets to visualize your Claude metrics.
Add widgets
Create the following widgets to gain insights into your Claude API usage:
Total API Requests
-
Click on
+ Widgetand select Number Chart. -
Fill in the following details:
-
Title:
Total API Requests. -
Description:
Total number of Claude API requests. -
Icon:
Api. -
Blueprint:
claude_usage_record. -
Chart type: Select
Aggregate by property. -
Property:
total_requests. -
Function:
Sum.
-
-
Click Save.
Total Cost
-
Click on
+ Widgetand select Number Chart. -
Fill in the following details:
-
Title:
Total Cost (USD). -
Description:
Total cost of Claude API usage. -
Icon:
DollarSign. -
Blueprint:
claude_usage_record. -
Chart type: Select
Aggregate by property. -
Property:
total_cost_usd. -
Function:
Sum.
-
-
Click Save.
API Success Rate
-
Click on
+ Widgetand select Number Chart. -
Fill in the following details:
-
Title:
API Success Rate. -
Description:
Overall success rate of API requests. -
Blueprint:
claude_usage_record. -
Chart type: Select
Aggregate by property. -
Property:
success_rate. -
Function:
Average.
-
-
Click Save.
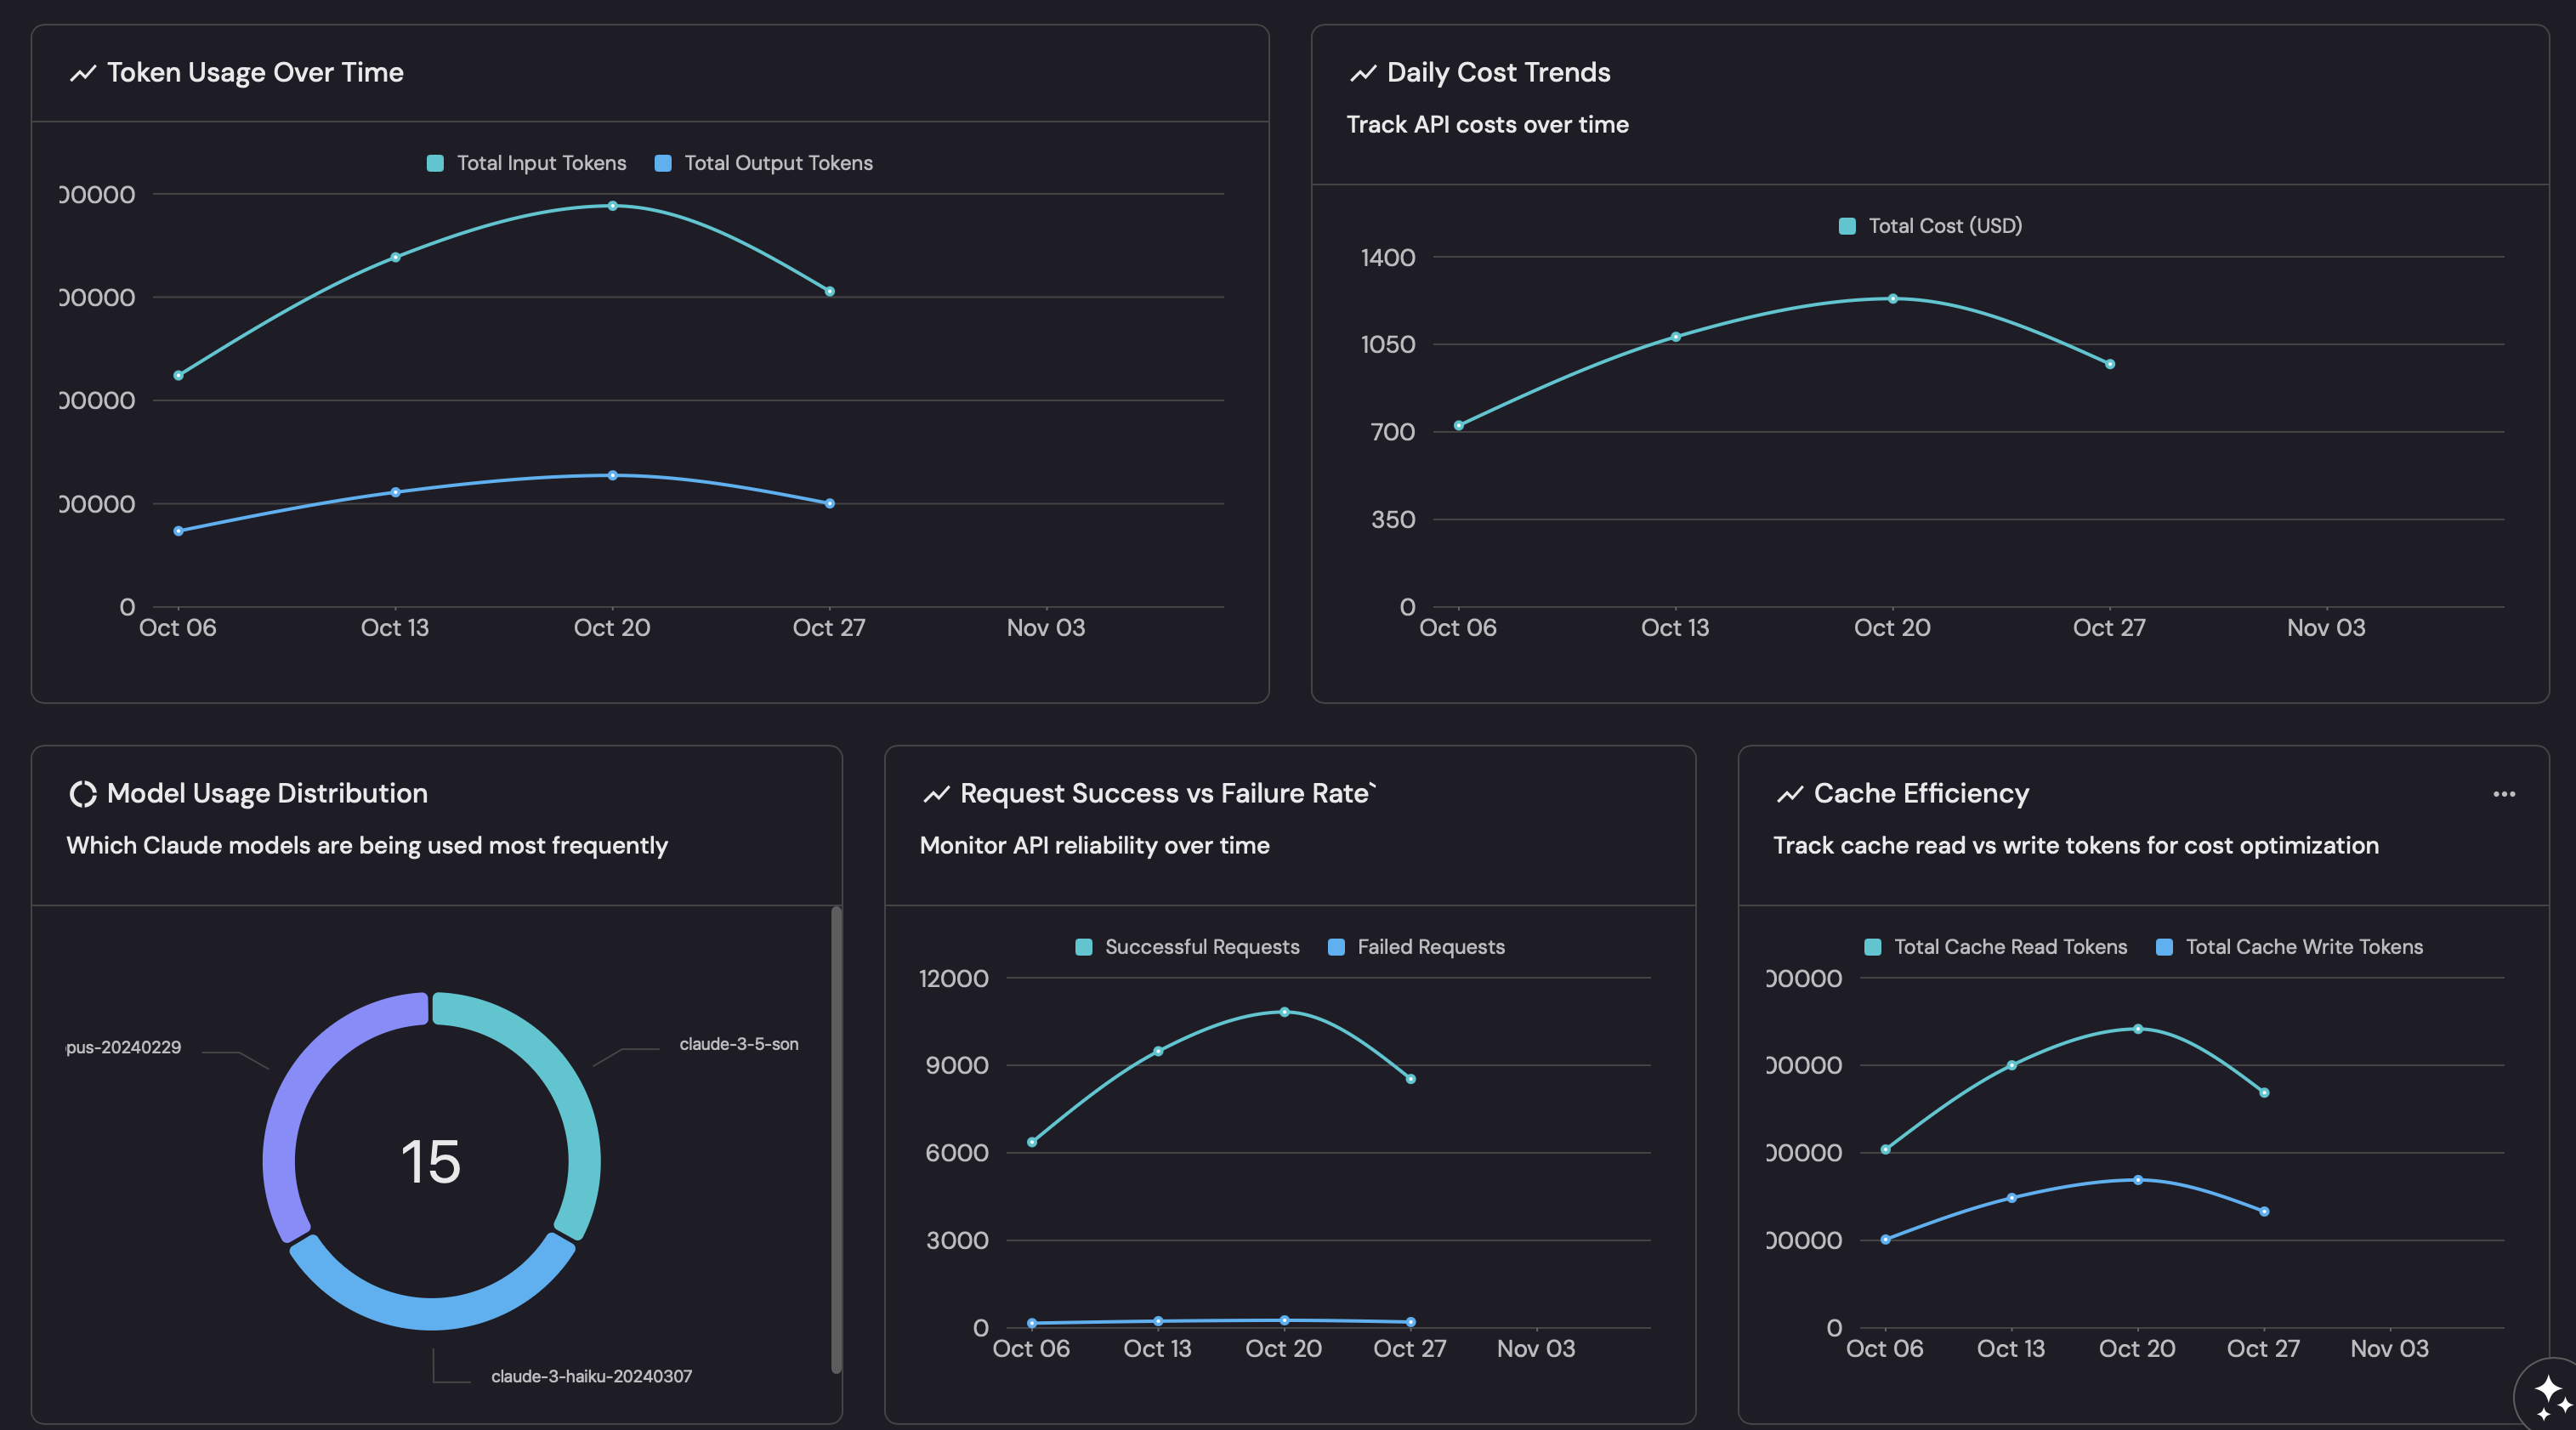
Token Usage Over Time
-
Click on
+ Widgetand select Line Chart. -
Fill in the following details:
-
Title:
Token Usage Over Time. -
Description:
Track input and output token consumption. -
Icon:
LineChart. -
Blueprint:
claude_usage_record. -
Chart type: Select
Aggregate by property. -
Property:
total_input_tokens,total_output_tokens. -
Function:
Sum. -
Time interval:
Week. -
Time range:
In the past 30 days. -
Measure time by:
record_date.
-
-
Click Save.
Daily Cost Trends
-
Click on
+ Widgetand select Line Chart. -
Fill in the following details:
-
Title:
Daily Cost Trends. -
Description:
Track API costs over time. -
Icon:
LineChart. -
Blueprint:
claude_usage_record. -
Chart type: Select
Aggregate by property. -
Property:
total_cost_usd. -
Function:
Sum. -
Time interval:
Week. -
Time range:
In the past 30 days. -
Measure time by:
record_date.
-
-
Click Save.
Model Usage Distribution
-
Click on
+ Widgetand select Pie Chart. -
Fill in the following details:
-
Title:
Model Usage Distribution. -
Description:
Which Claude models are being used most frequently. -
Icon:
Pie. -
Blueprint:
claude_model_usage. -
Property:
model_name.
-
-
Click Save.
Request Success vs Failure Rate
-
Click on
+ Widgetand select Line Chart. -
Fill in the following details:
-
Title:
Request Success vs Failure Rate. -
Description:
Monitor API reliability over time. -
Icon:
LineChart. -
Blueprint:
claude_usage_record. -
Chart type: Select
Aggregate by property. -
Property:
successful_requests,failed_requests. -
Function:
Sum. -
Time interval:
Week. -
Time range:
In the past 30 days. -
Measure time by:
record_date.
-
-
Click Save.
Claude Code Activity
-
Click on
+ Widgetand select Line Chart. -
Fill in the following details:
-
Title:
Claude Code Activity. -
Description:
Track Claude Code sessions, commits, and PRs over time. -
Icon:
LineChart. -
Blueprint:
claude_code_analytics. -
Chart type: Select
Aggregate by property. -
Property:
total_sessions,total_commits,total_pull_requests. -
Function:
Sum. -
Time interval:
Week. -
Time range:
In the past 30 days. -
Measure time by:
record_date.
-
-
Click Save.
Cache Efficiency
-
Click on
+ Widgetand select Line Chart. -
Fill in the following details:
-
Title:
Cache Efficiency. -
Description:
Track cache read vs write tokens for cost optimization. -
Icon:
LineChart. -
Blueprint:
claude_usage_record. -
Chart type: Select
Aggregate by property. -
Property:
total_cache_read_tokens,total_cache_write_tokens. -
Function:
Sum. -
Time interval:
Week. -
Time range:
In the past 30 days. -
Measure time by:
record_date.
-
-
Click Save.