Query DORA metrics using Port MCP
This guide demonstrates how to use Port's Model Context Protocol (MCP) server to query DORA metrics using natural language commands directly from your IDE or AI-powered tools. By leveraging the MCP server, you can access deployment frequency, lead time, change failure rate, and mean time to recovery data without leaving your development environment.
Common use cases
- Team performance analysis: Compare DORA metrics across different teams to identify top performers and areas for improvement.
- Sprint retrospectives: Get quick insights into deployment frequency and lead times during team retrospectives.
- Engineering leadership reporting: Generate on-demand reports for stakeholders about team velocity and reliability.
- Incident response: Quickly assess team MTTR during post-incident reviews and identify patterns.
- Continuous improvement: Monitor trends in change failure rates and deployment frequencies over time.
Prerequisites
This guide assumes you have:
- A Port account with deployment and incident data available.
- Cursor IDE installed (we'll focus on Cursor, but you can also use VSCode, Claude, or other MCP-compatible tools).
- Basic understanding of DORA metrics concepts.
Port's MCP server enables DORA insights in two complementary ways:
-
With DORA Metrics Experience: If you have DORA metrics set up, the MCP provides deterministic results over time, customized dashboards, and team-specific views. This gives you consistent, aggregated metrics that align with your organization's definitions.
-
Dynamic DORA Calculations: Even without the formal DORA metrics setup, the MCP server can analyze your deployment and incident data on-the-fly to calculate DORA metrics. This approach provides quick insights for data you might not have aggregated yet in a proper way, letting you explore different definitions and time periods flexibly.
Both approaches work together - you can start with dynamic calculations to explore your data, then implement the DORA experience for consistent tracking and dashboards.
Set up Port MCP server
The Port MCP server enables you to interact with your Port data using natural language queries directly from your IDE or AI tools.
Installing Port MCP
Installing Port's MCP is simple. Follow the instructions for your preferred tool, or learn about the archived local MCP server.
- Cursor
- VSCode
- Claude
- Local MCP
To connect Cursor to Port's remote MCP, follow these steps:
-
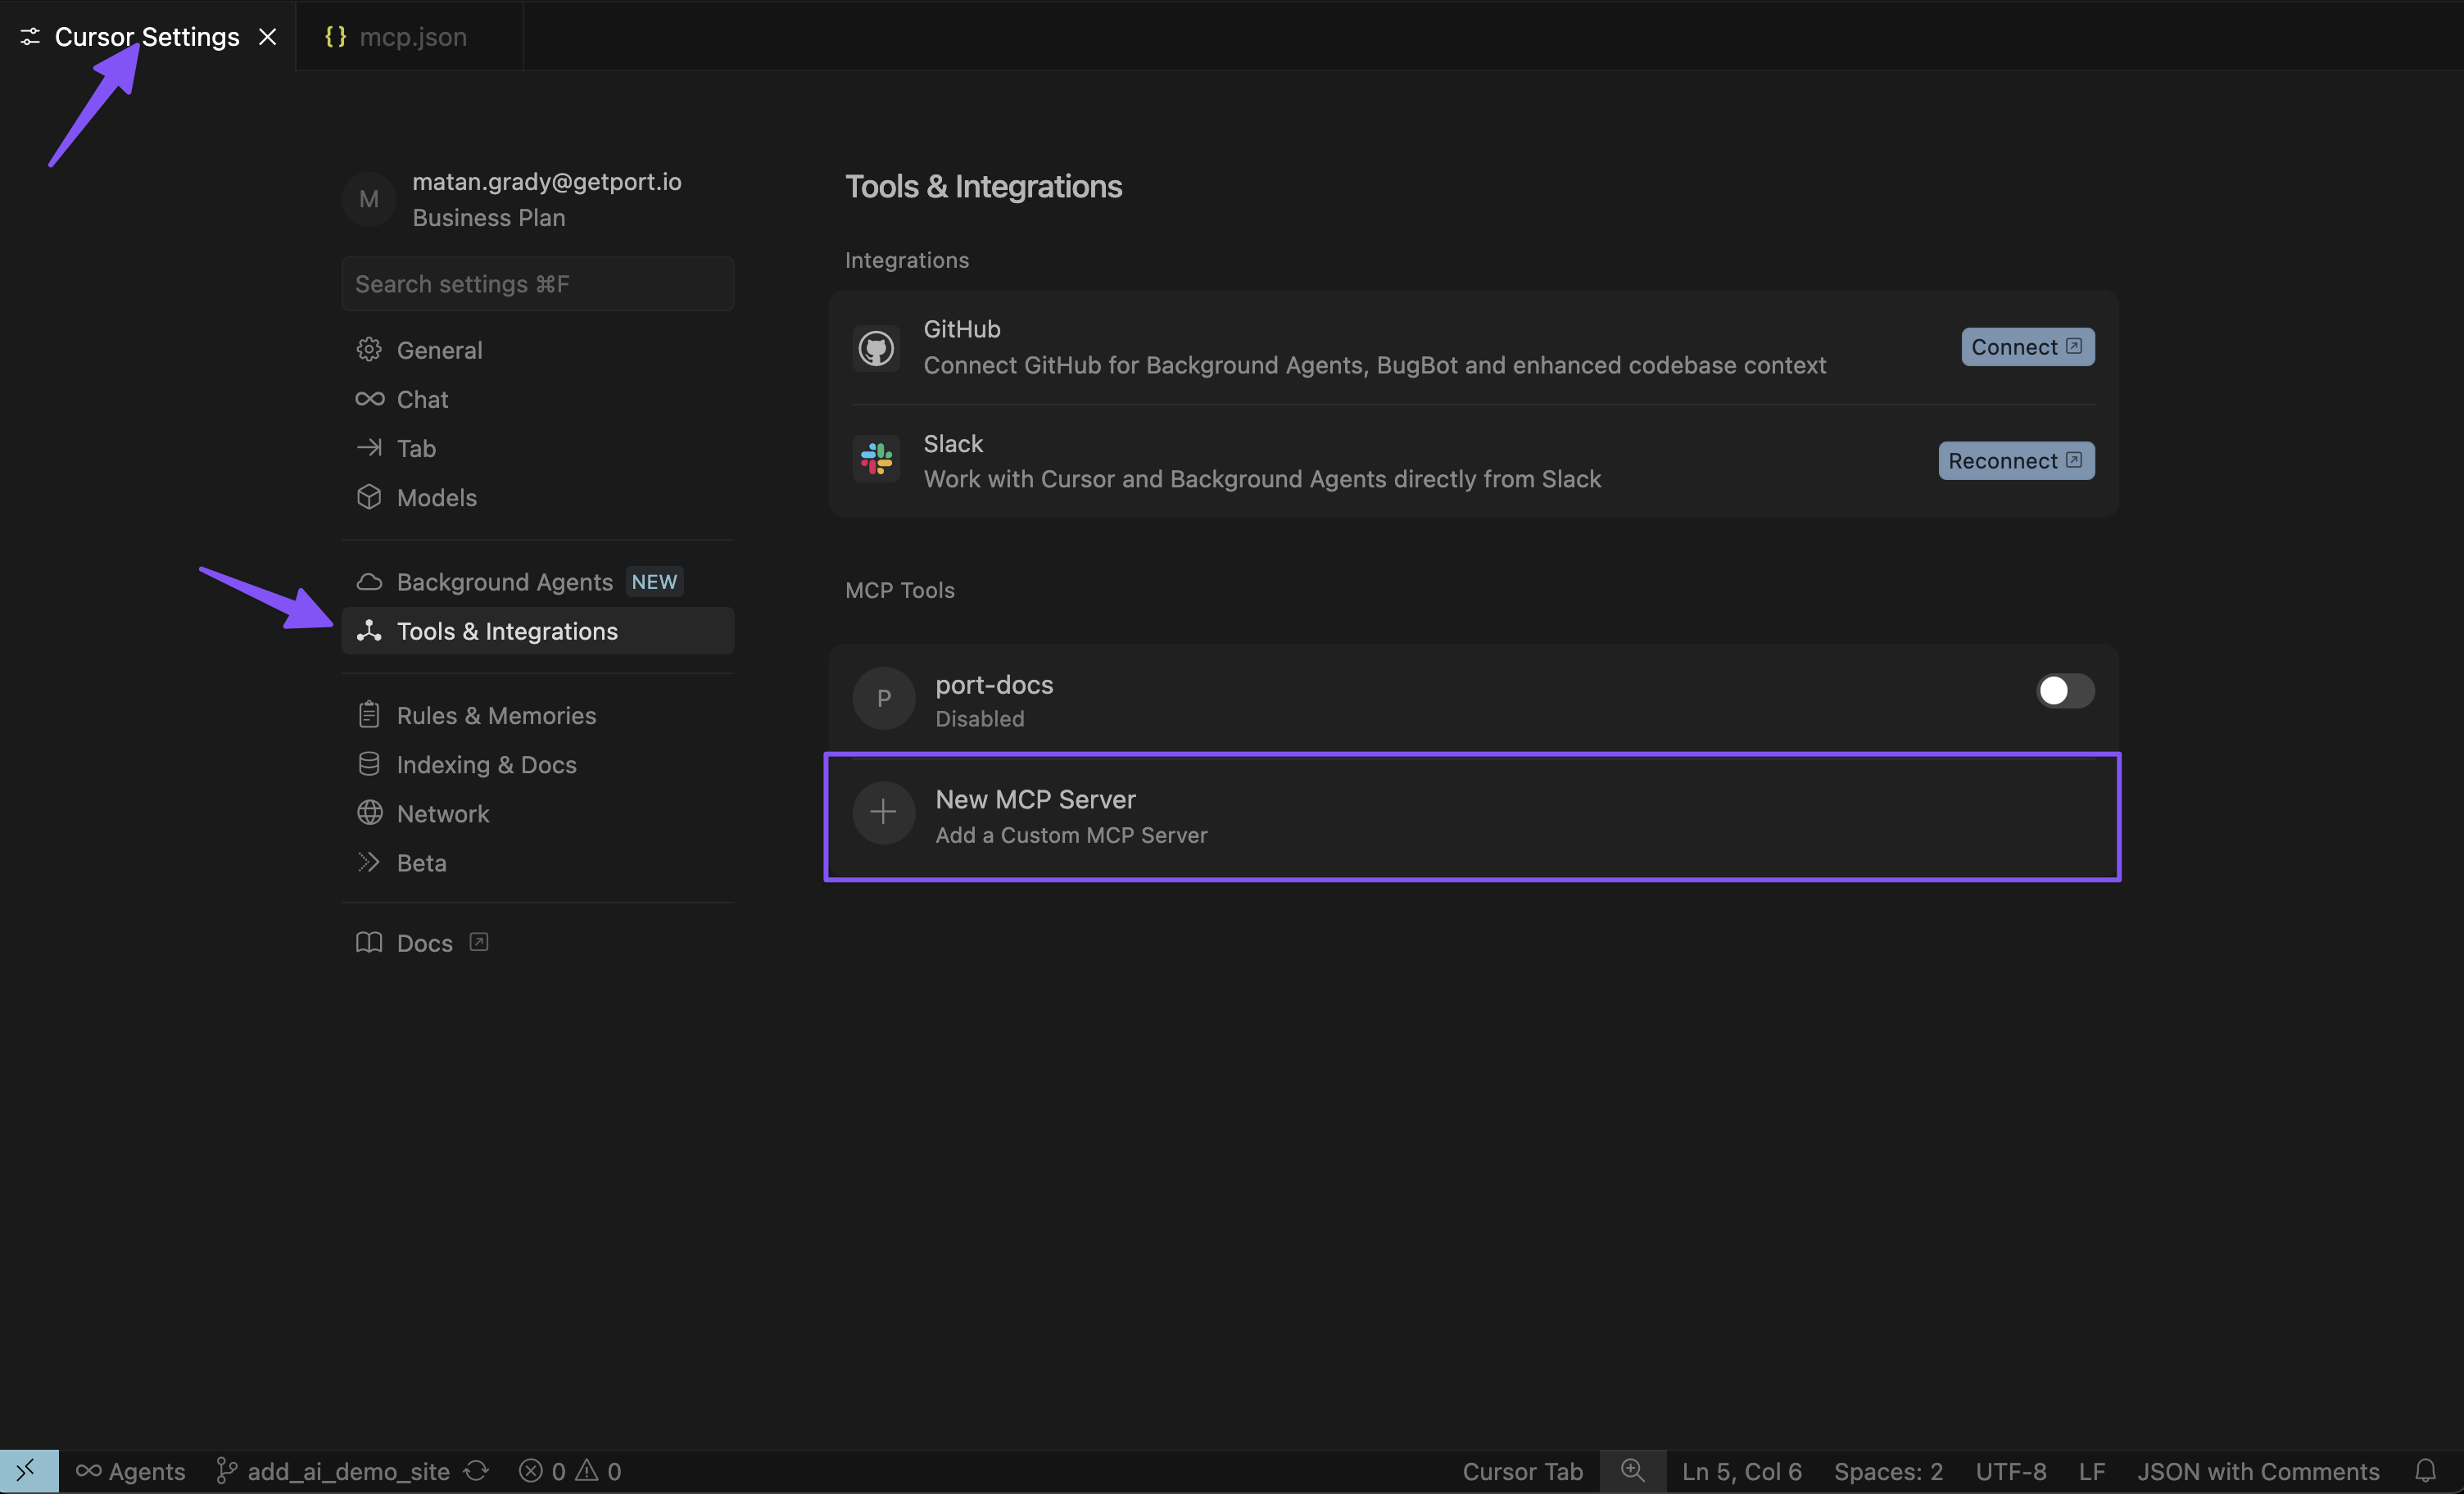
Open Cursor settings
Go to Cursor settings, click on Tools & Integrations, and add a new MCP server.
-
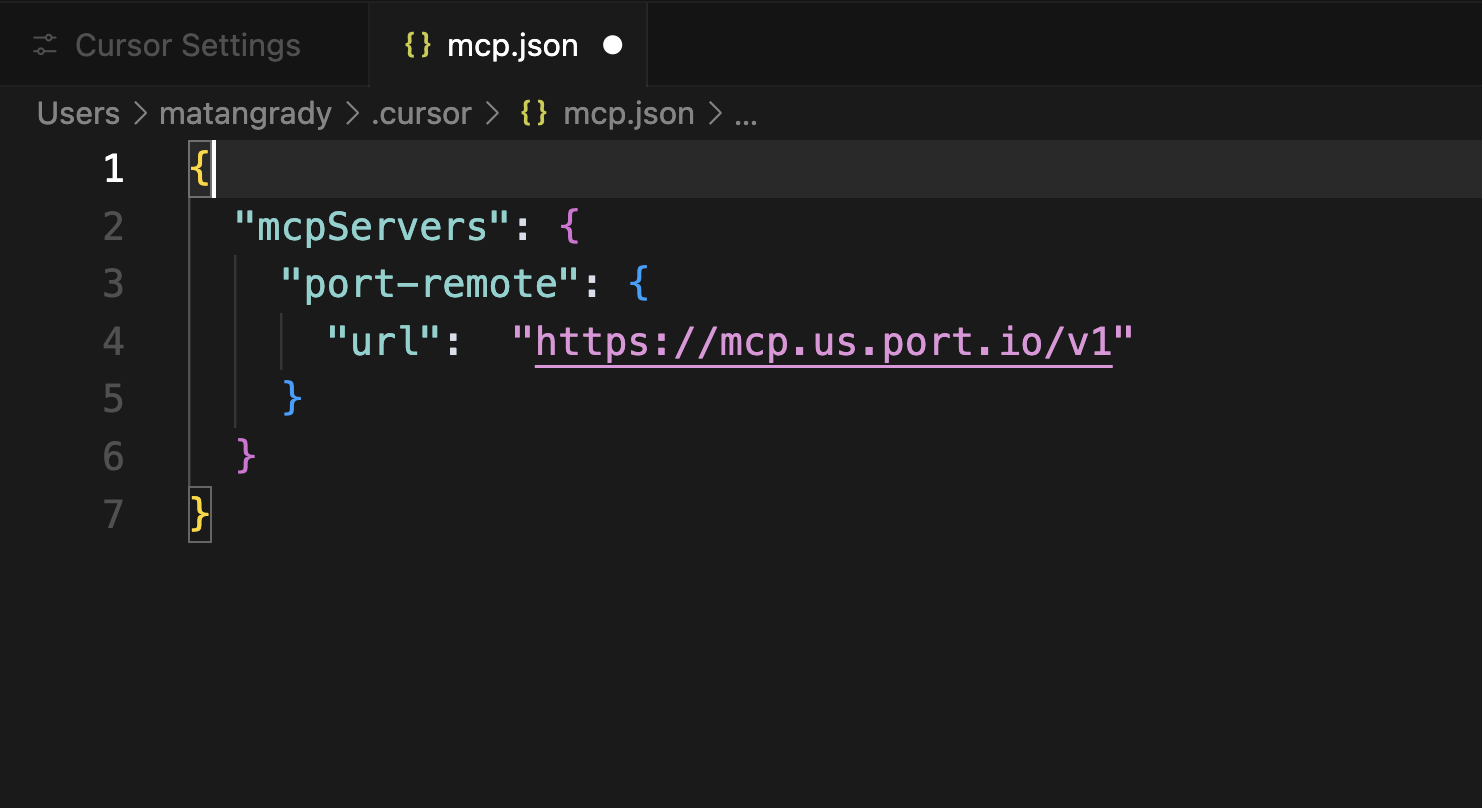
Configure the MCP server
Add the appropriate configuration for your Port region:
- EU
- US
{
  "mcpServers": {
    "port-eu": {
      "url": "https://mcp.port.io/v1"
    }
  }
}
{
  "mcpServers": {
    "port-us": {
      "url": "https://mcp.us.port.io/v1"
    }
  }
}
-
Authenticate with Port
Click on "Needs login" and complete the authentication flow in the window that opens.

-
Verify connection
After successful authentication, you'll see the list of available tools from the MCP server.
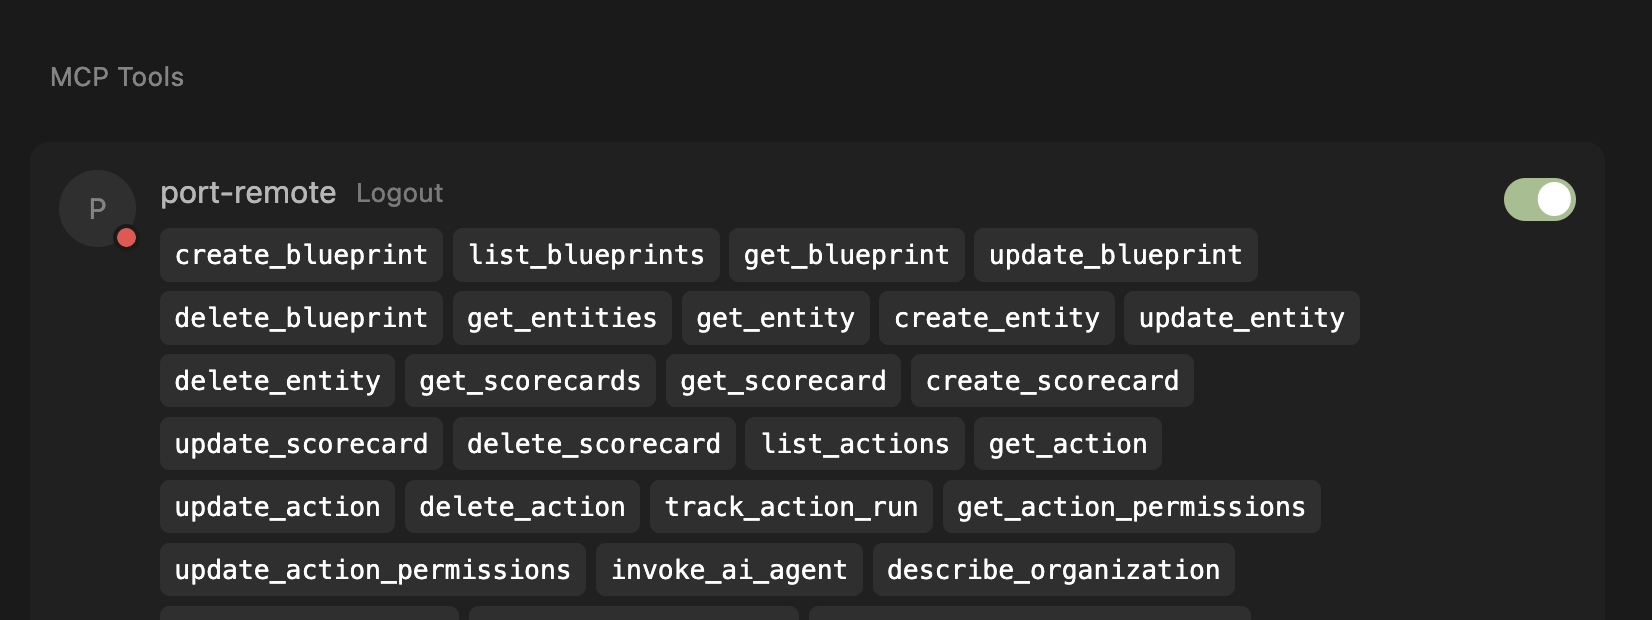
In some cases, after clicking "Accept" in the authentication popup, the window won't get closed but the connection is established successfully. You can safely close the window.
If you still don't see the tool, try it a couple of times. We are aware of this behavior and working to improve it.
To connect VSCode to Port's remote MCP server, follow these detailed steps. For complete instructions, refer to the official VS Code MCP documentation.
Before proceeding, ensure your VS Code is updated to the latest version and that MCP is enabled for your GitHub organization. You may need to enable "Editor preview features" under Settings > Code, planning, and automation > Copilot via admin access from your organization.
This configuration uses the open-source mcp-remote package, which requires Node.js to be installed on your system. Before using the configuration, ensure Node.js is available by running:
npx -y mcp-remote --help
If you encounter errors:
- Missing Node.js: Install Node.js from nodejs.org
- Network issues: Check your internet connection and proxy settings
- Permission issues: You may need to run with appropriate permissions
In some versions of VS Code, the MCP server might not start or return an error in the chat because of a configuration issue with the action related tools. To deal with it, deselect the tools create_action, update_action, and delete_action.
This is relevant for cases where you see an error like this one:
Failed to validate tool mcp_port_create_action: Error: tool parameters array type must have items. Please open a Github issue for the MCP server or extension which provides this tool
Step 1: Configure MCP Server Settings
- Open VS Code settings
- Search for "MCP: Open user configuration" (or follow the instructions on a workspace installation)
- Add the server configuration using the appropriate configuration for your region:
- EU
- US
{
  "mcpServers": {
    "port-vscode-eu": {
      "command": "npx",
      "args": [
        "-y",
        "mcp-remote",
        "https://mcp.port.io/v1"
      ]
    }
  }
}
{
  "mcpServers": {
    "port-vscode-us": {
      "command": "npx",
      "args": [
        "-y",
        "mcp-remote",
        "https://mcp.us.port.io/v1"
      ]
    }
  }
}
Step 2: Start the MCP Server
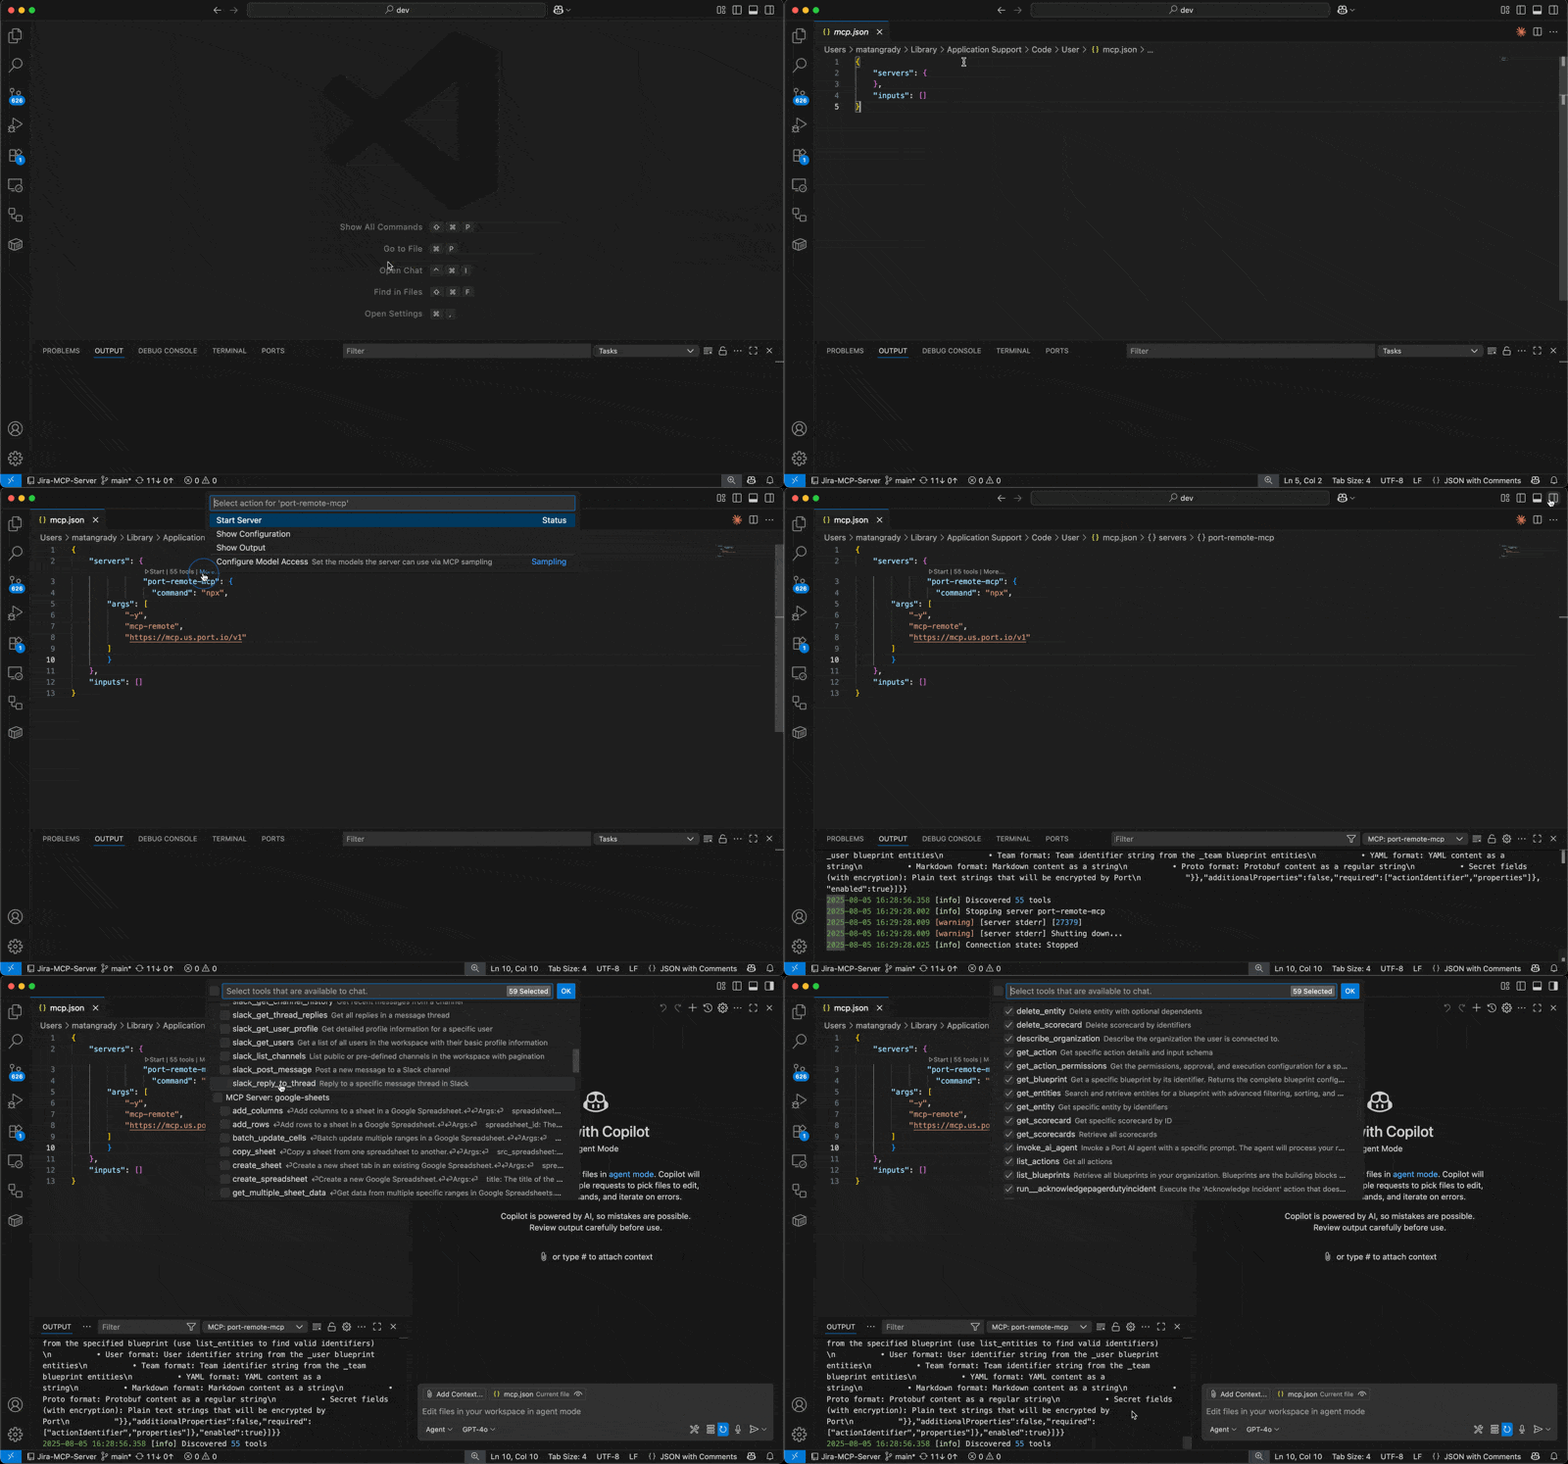
- After adding the configuration, click on "Start" to initialize the MCP server
- If you don't see the "Start" button, ensure:
- Your VS Code version is updated to the latest version
- MCP is enabled for your GitHub organization
- "Editor preview features" is enabled under Settings > Code, planning, and automation > Copilot
Step 3: Verify Connection
- Once started, you should see the number of available tools displayed
- If you don't see the tools count:
- Click on "More" to expand additional options
- Select "Show output" to view detailed logs
- Check the output panel for any error messages or connection issues
Step 4: Access Port Tools
- Start a new chat session in VS Code
- Click on the tools icon in the chat interface
- You should now see Port tools available for use
To connect Claude to Port's remote MCP, you need to create a custom connector. This process does not require a client ID. For detailed instructions, refer to the official Anthropic documentation on custom connectors.
When prompted for the remote MCP server URL, use the appropriate URL for your region:
- EU
- US
https://mcp.port.io/v1
https://mcp.us.port.io/v1
The local MCP server is an open-source project that you can run on your own infrastructure. It offers a similar set of capabilities, but requires manual setup and maintenance.
While you can use it, we are no longer supporting it and are not tracking the project issues and activities.
Prerequisites
- A Port.io account with appropriate permissions.
- Your Port credentials (Client ID and Client Secret). You can create these from your Port.io dashboard under Settings > Credentials.
Installation
The Port MCP Server can be installed using Docker or uvx (a package manager for Python). While the setup is straightforward, the specifics can vary based on your chosen MCP client (Claude, Cursor, VS Code, etc.).
For comprehensive, step-by-step installation instructions for various platforms and methods (Docker, UVX), please refer to the Port MCP Server GitHub README. The README provides the latest configuration details and examples for different setups.
Let's test the queries
Once you have the MCP server configured, you can start using natural language to query your DORA metrics.
Start a new chat session
- Open a new chat session in Cursor (Cmd/Ctrl + L).
- You should see the Port tools available in the tools panel.
- Start your conversation with DORA metrics queries.
Example DORA metrics queries
Here are practical examples of questions you can ask to get insights from your DORA metrics:
Team performance analysis
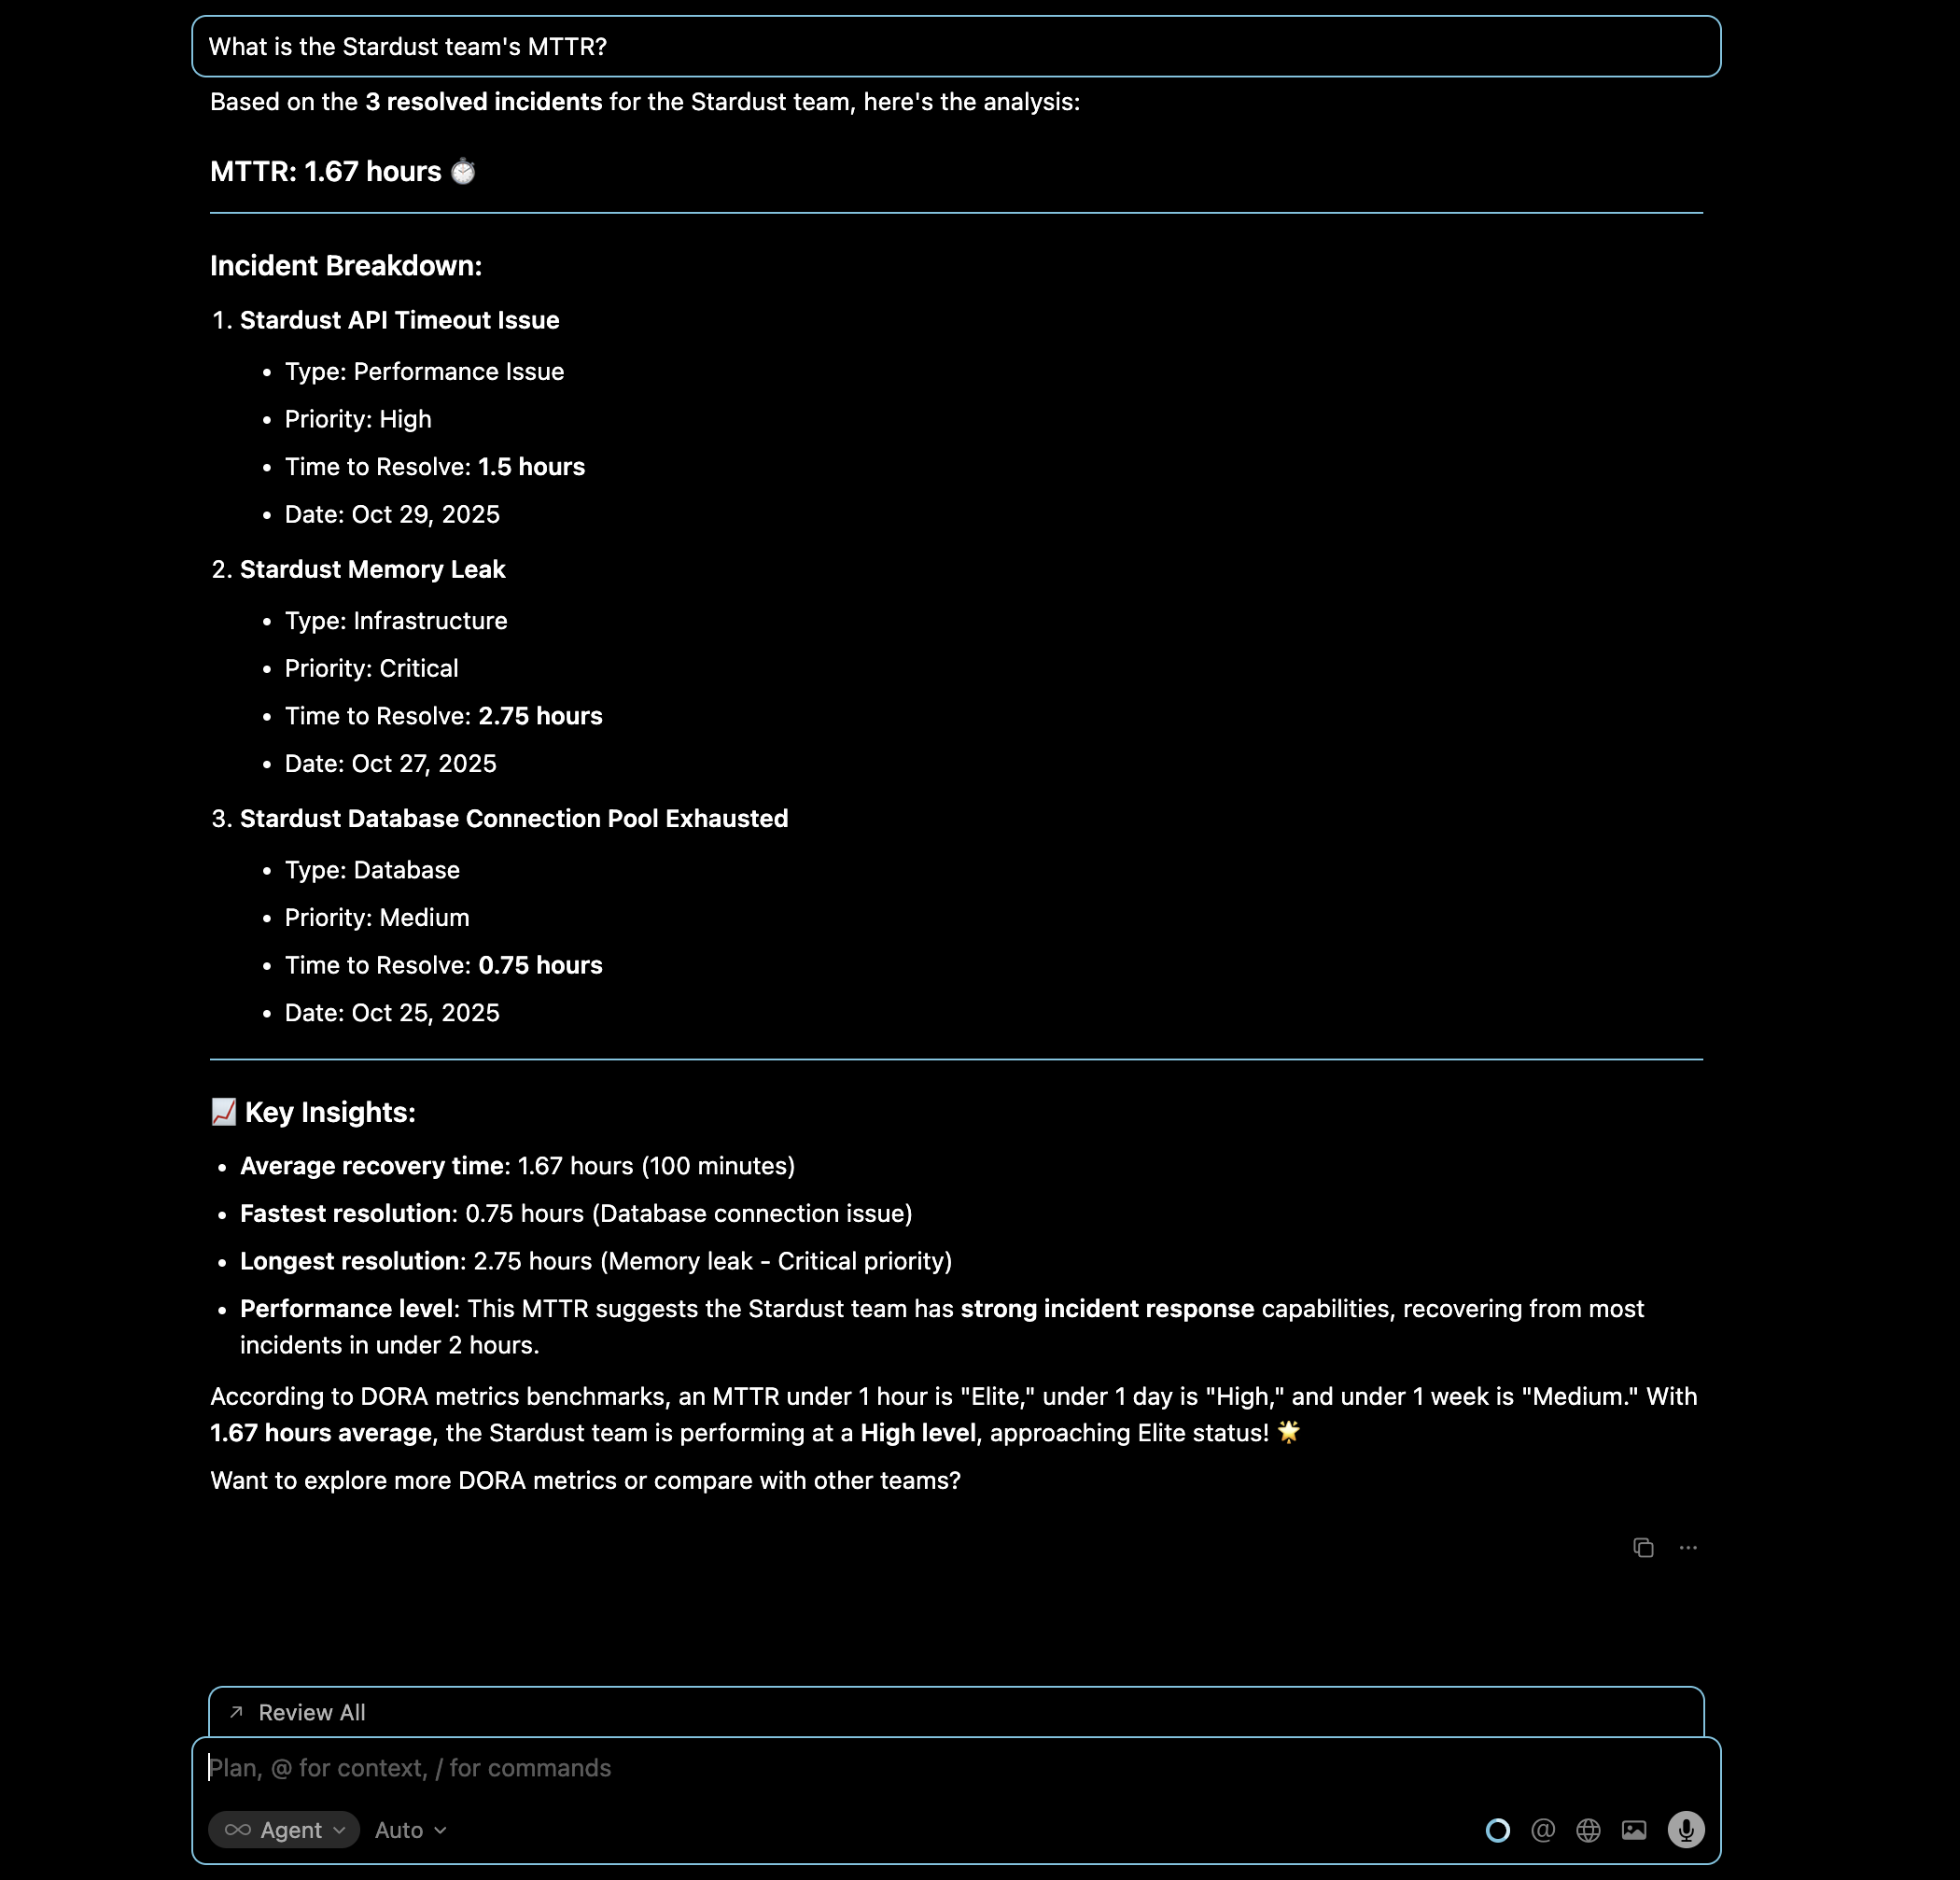
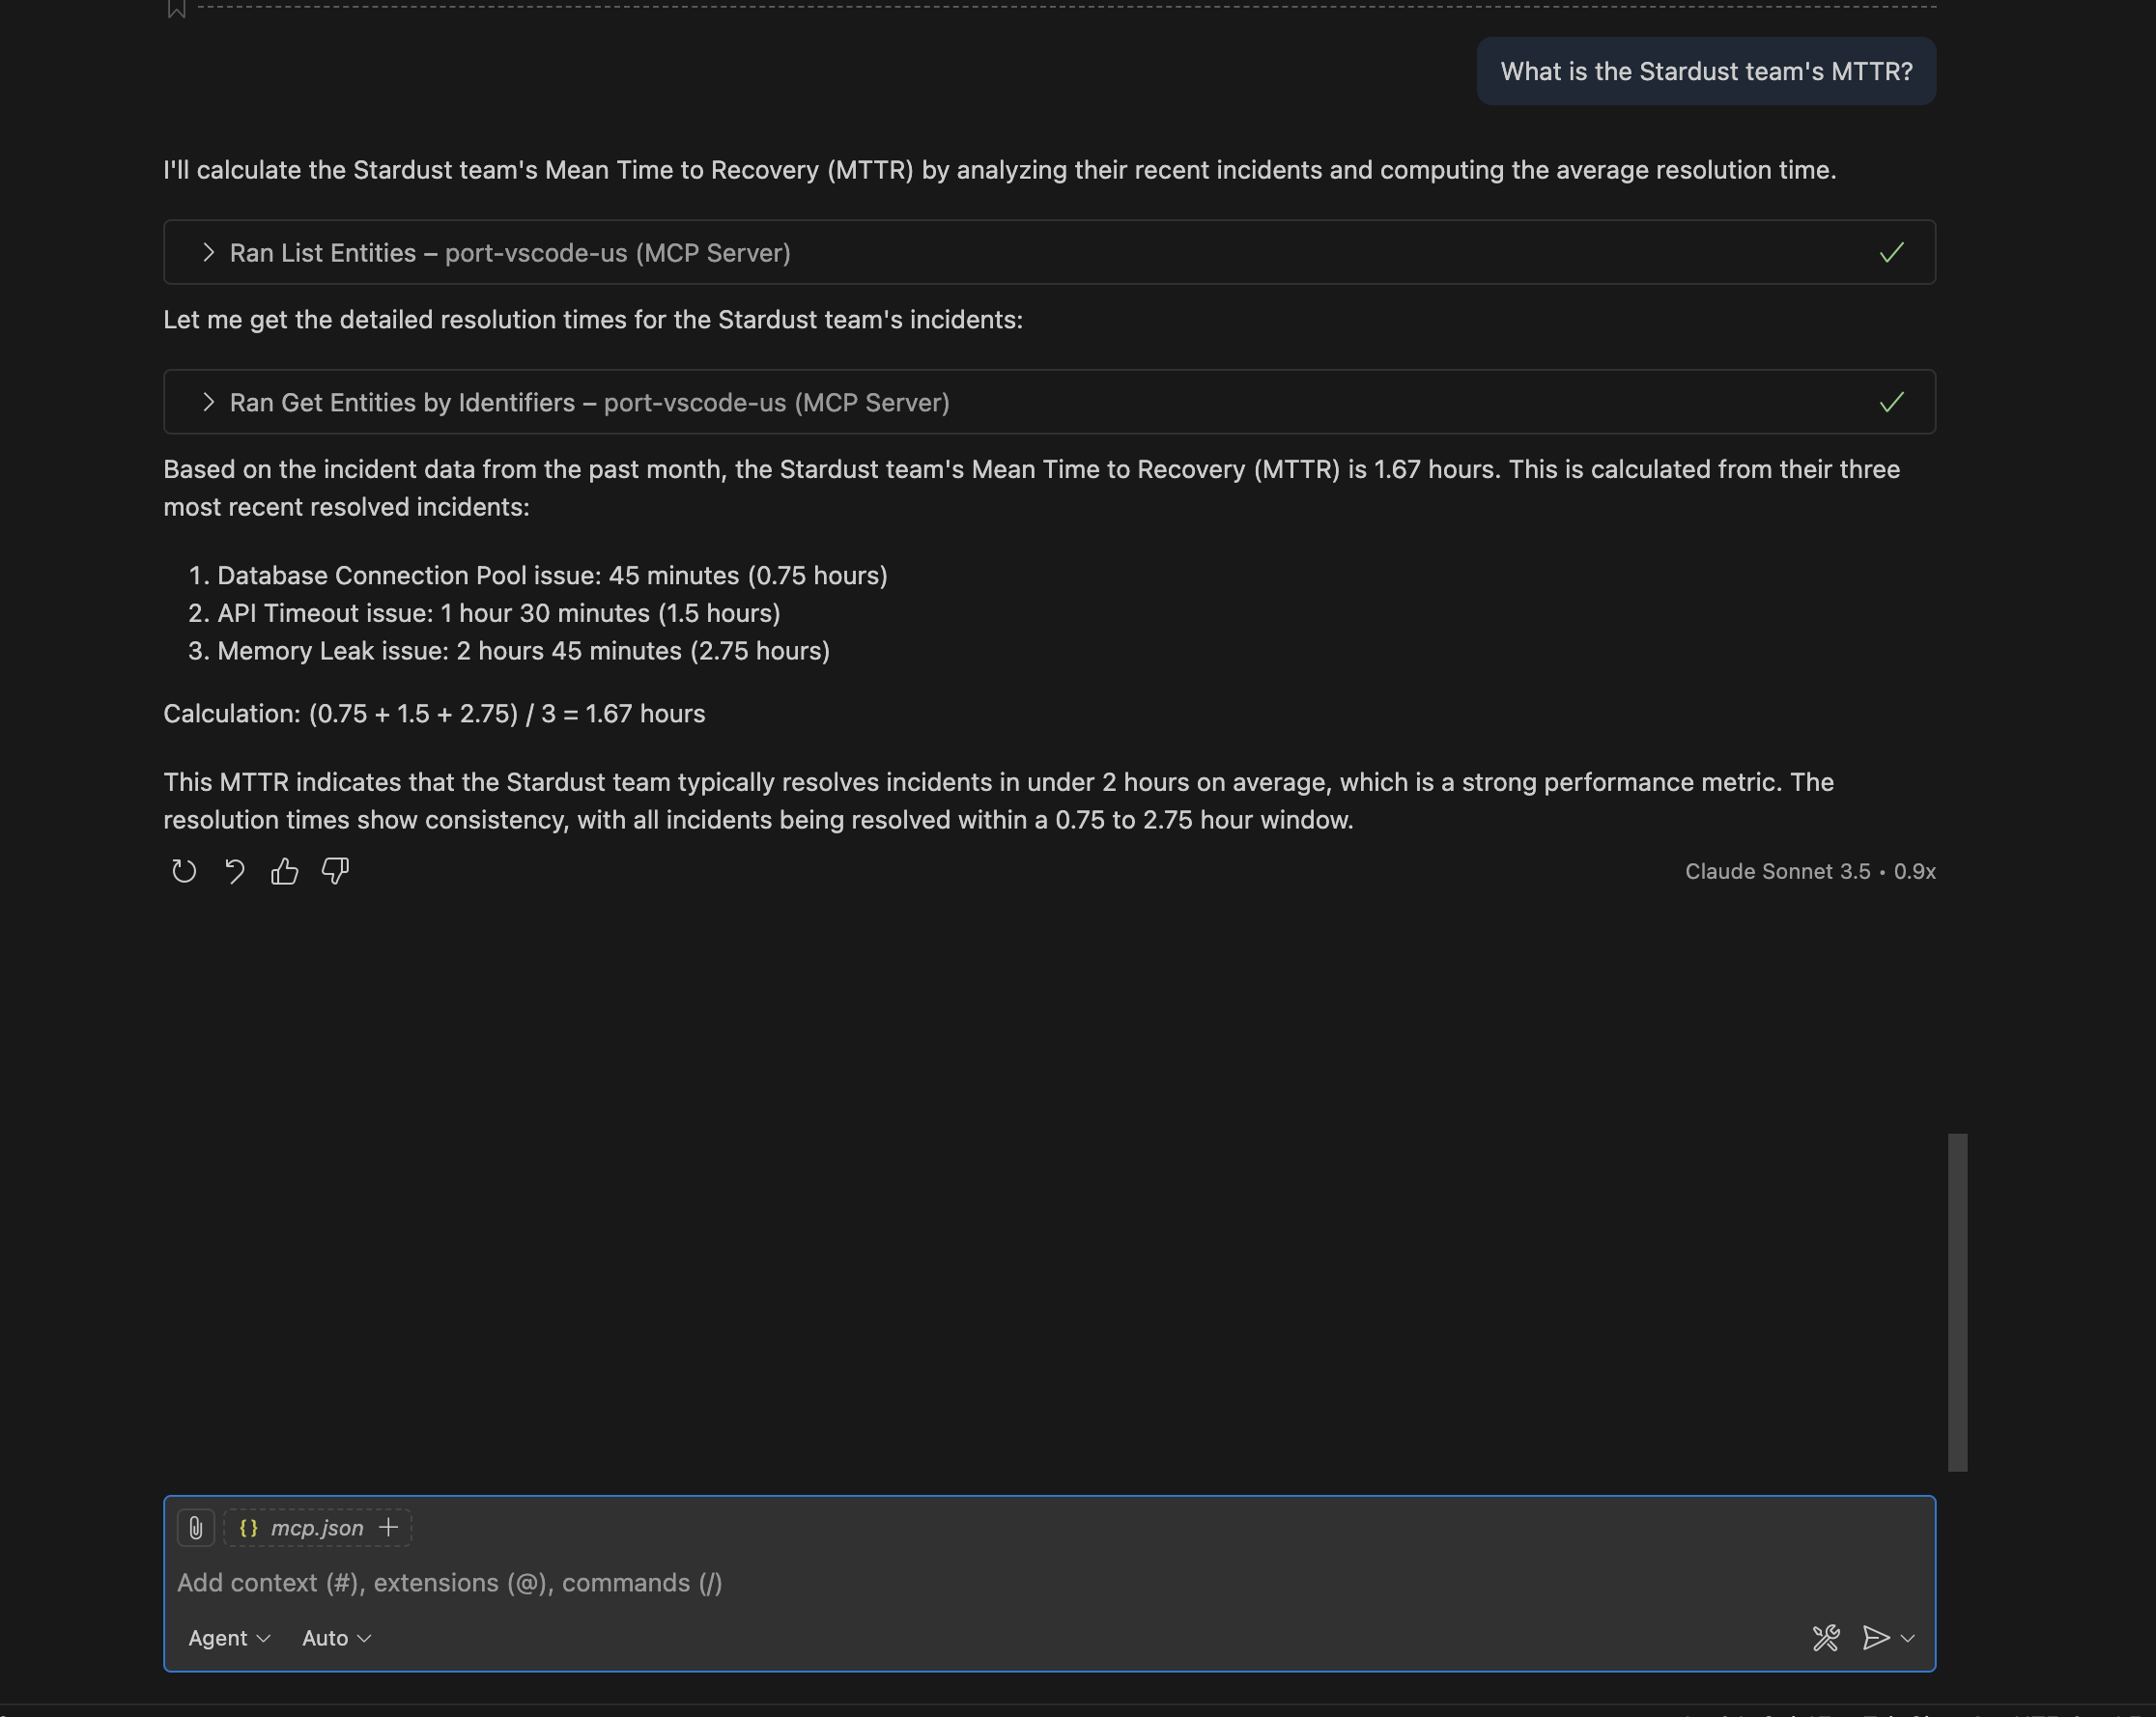
Query: "What is the Stardust team's MTTR?"
This query helps you understand how quickly the Stardust team recovers from incidents, which is crucial for assessing team reliability and incident response capabilities.
- Cursor IDE
- VS Code
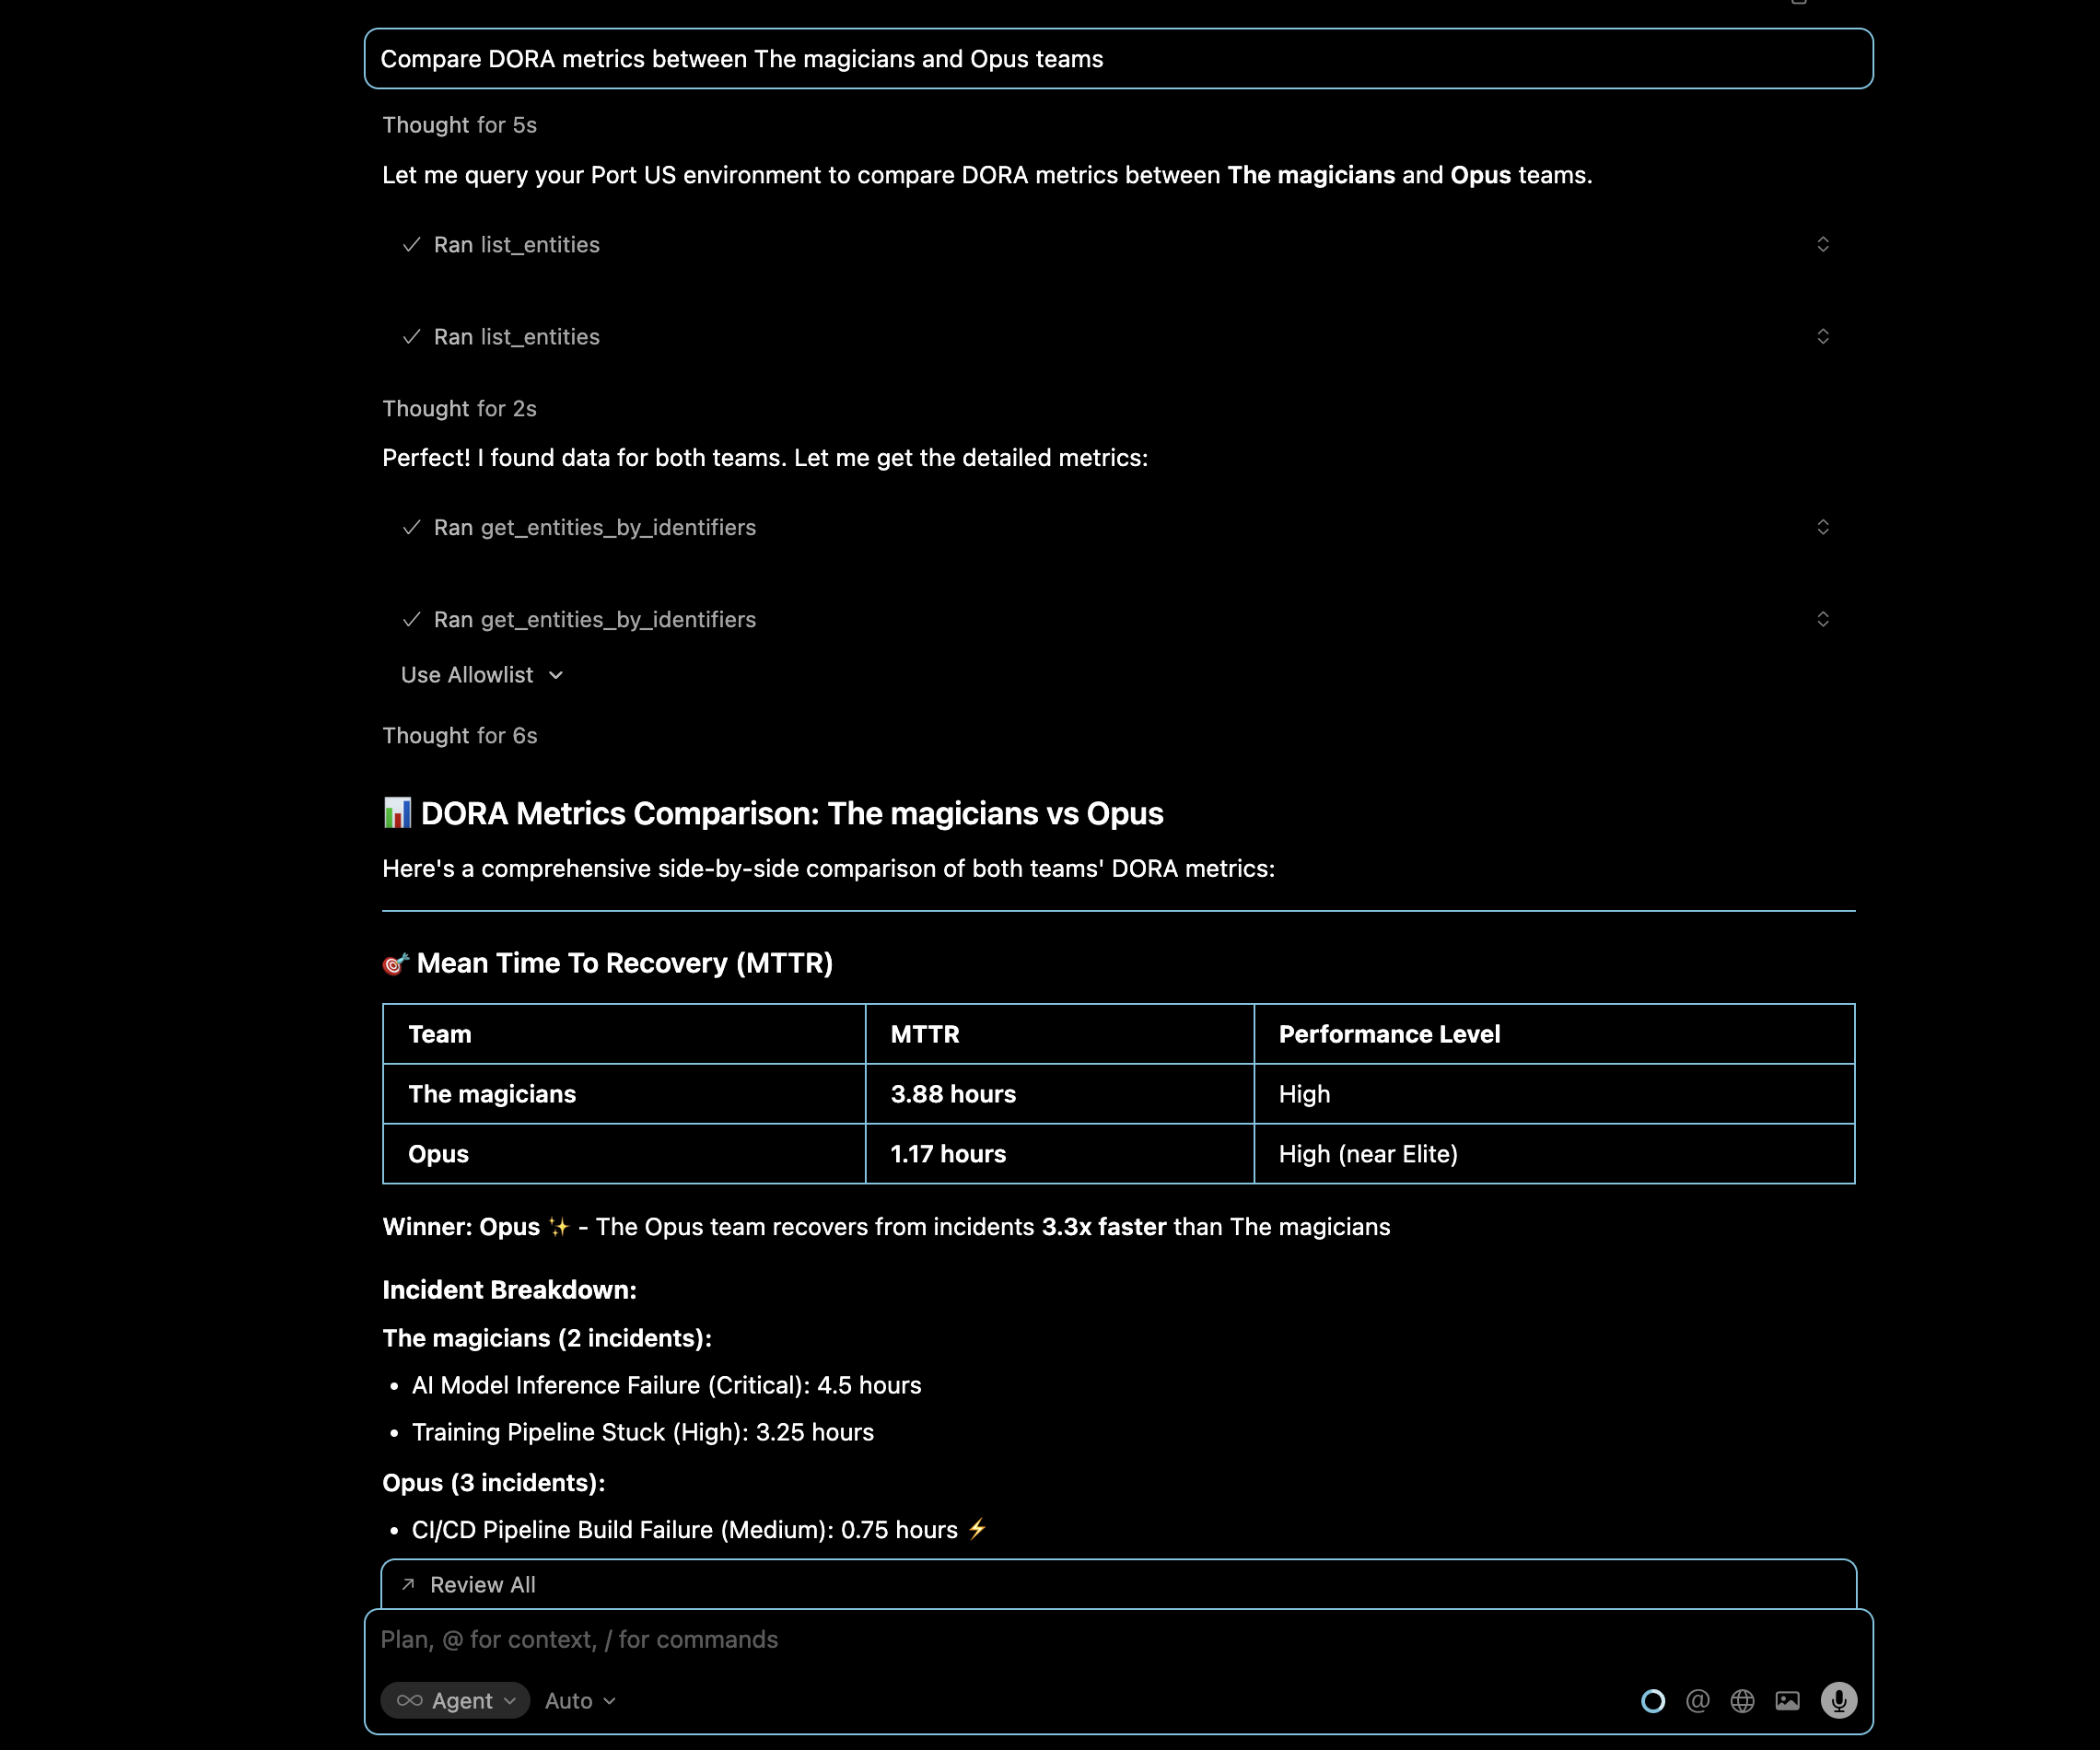
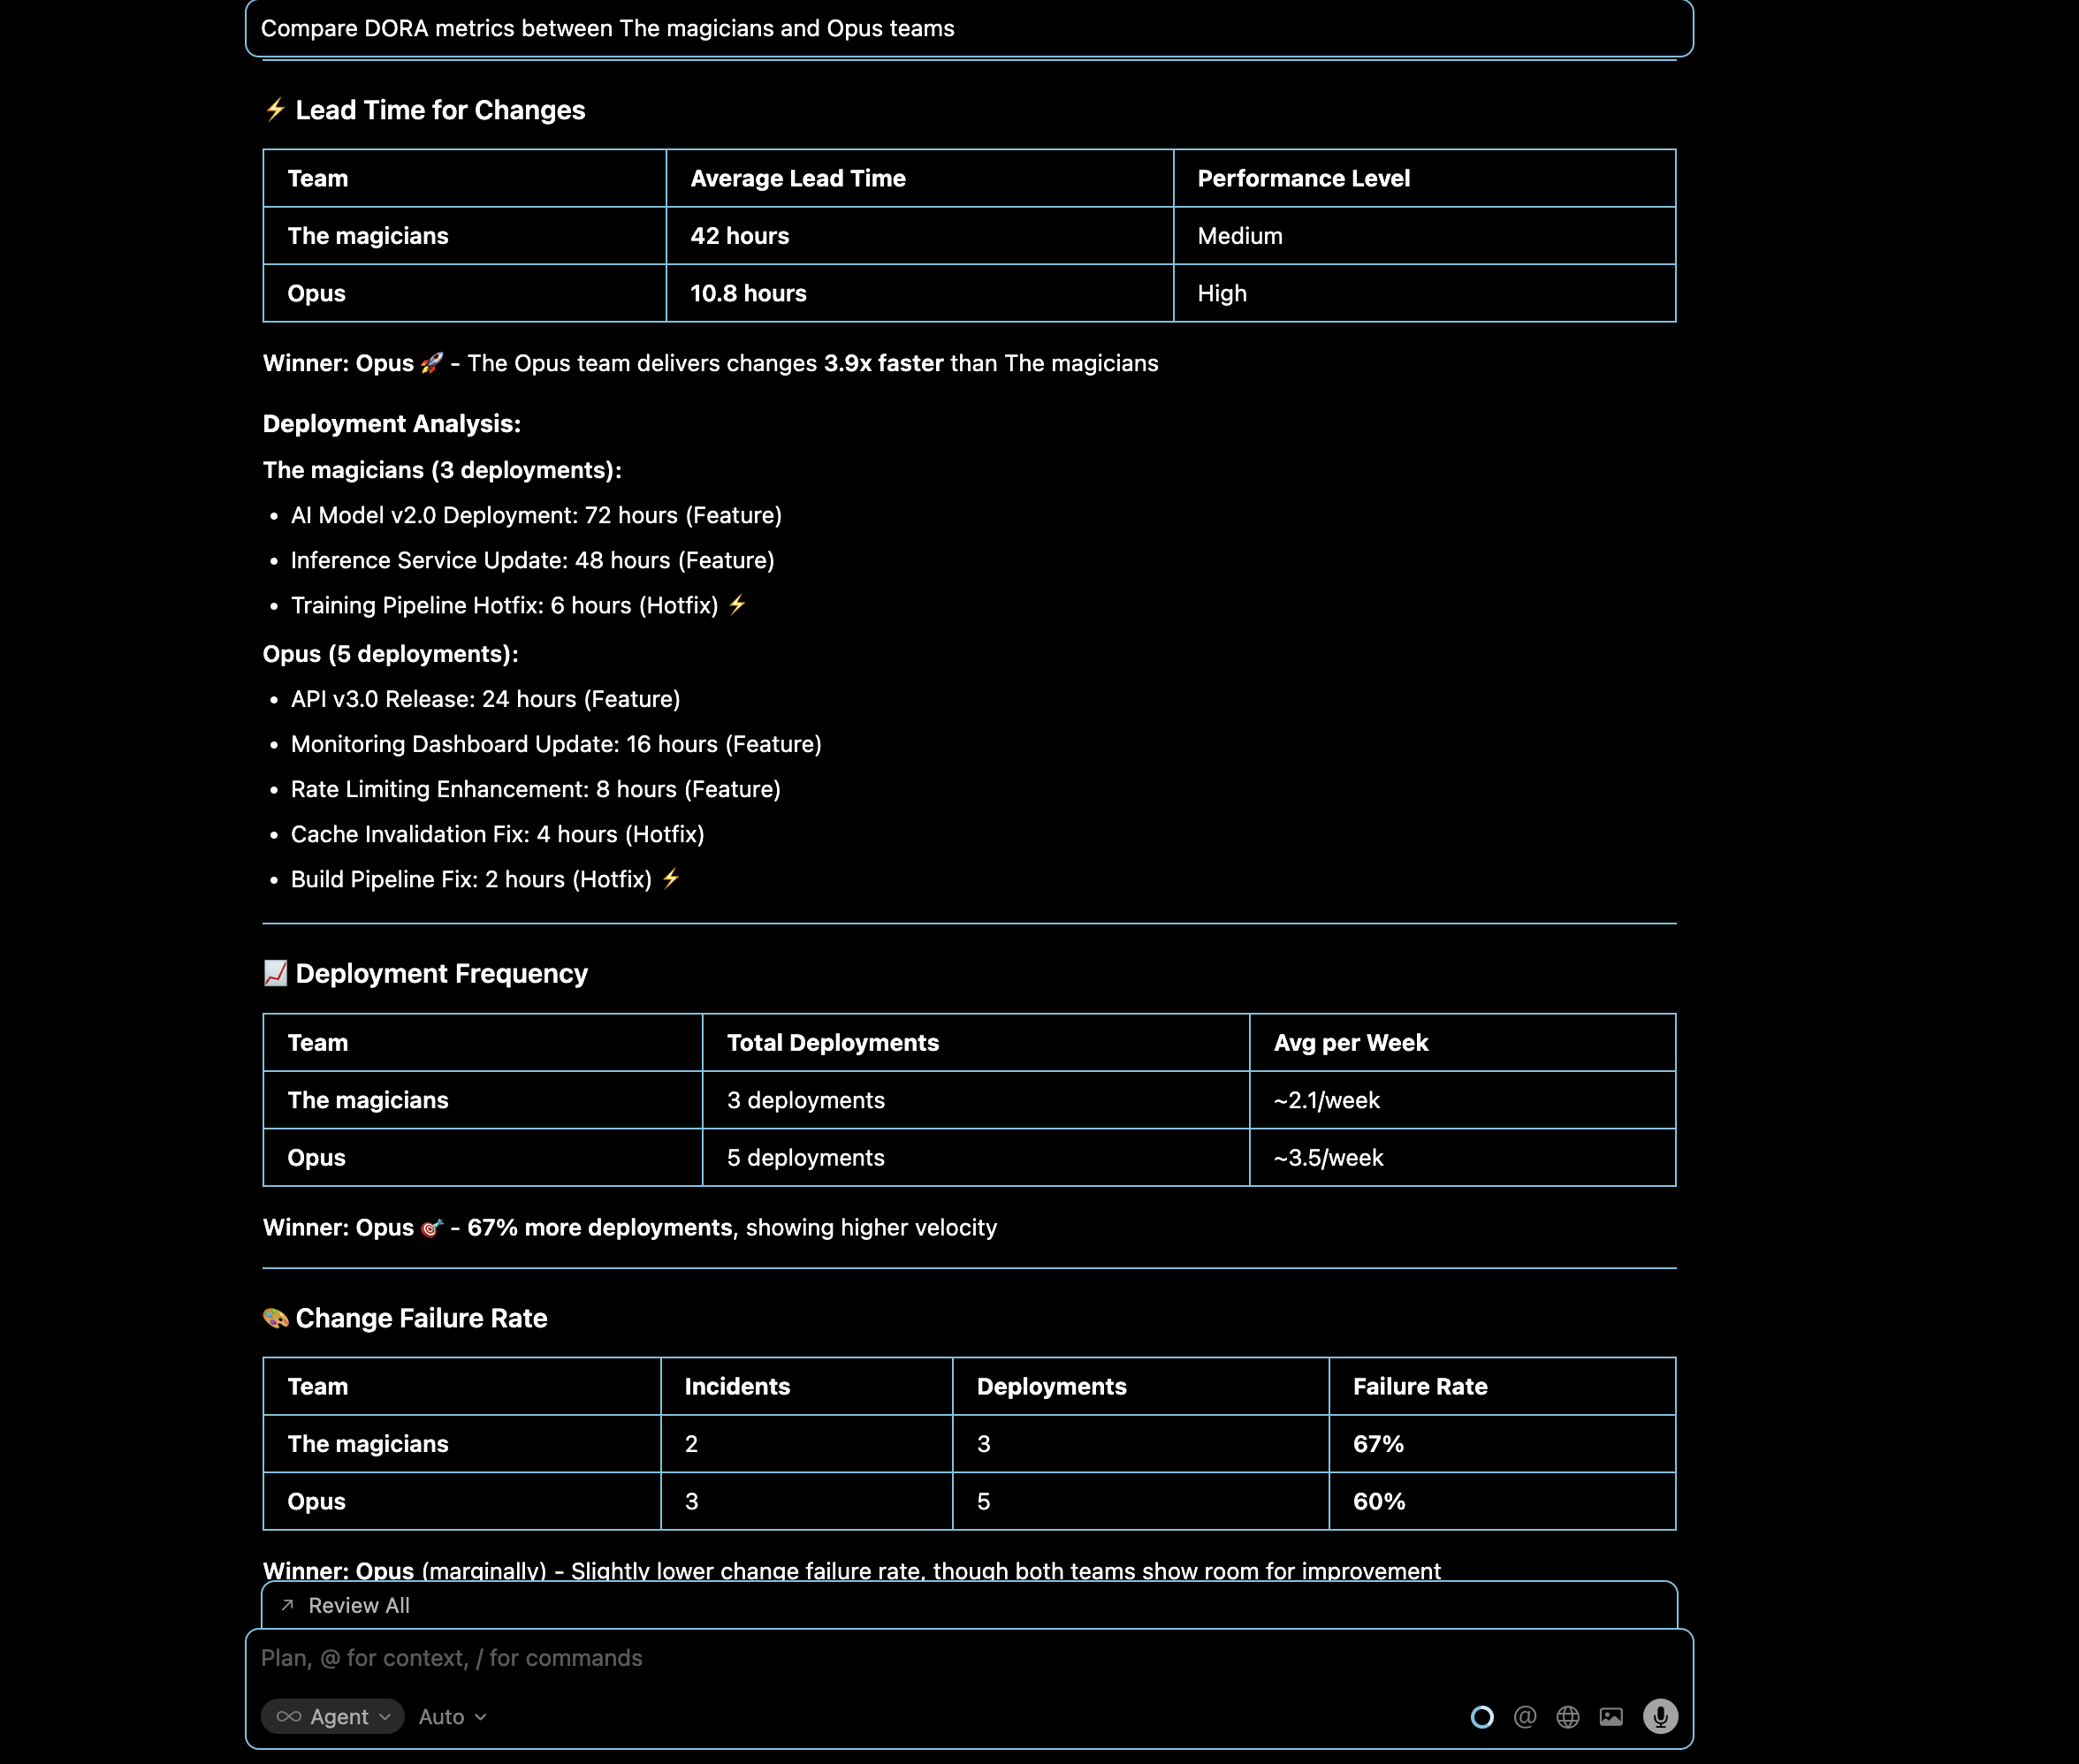
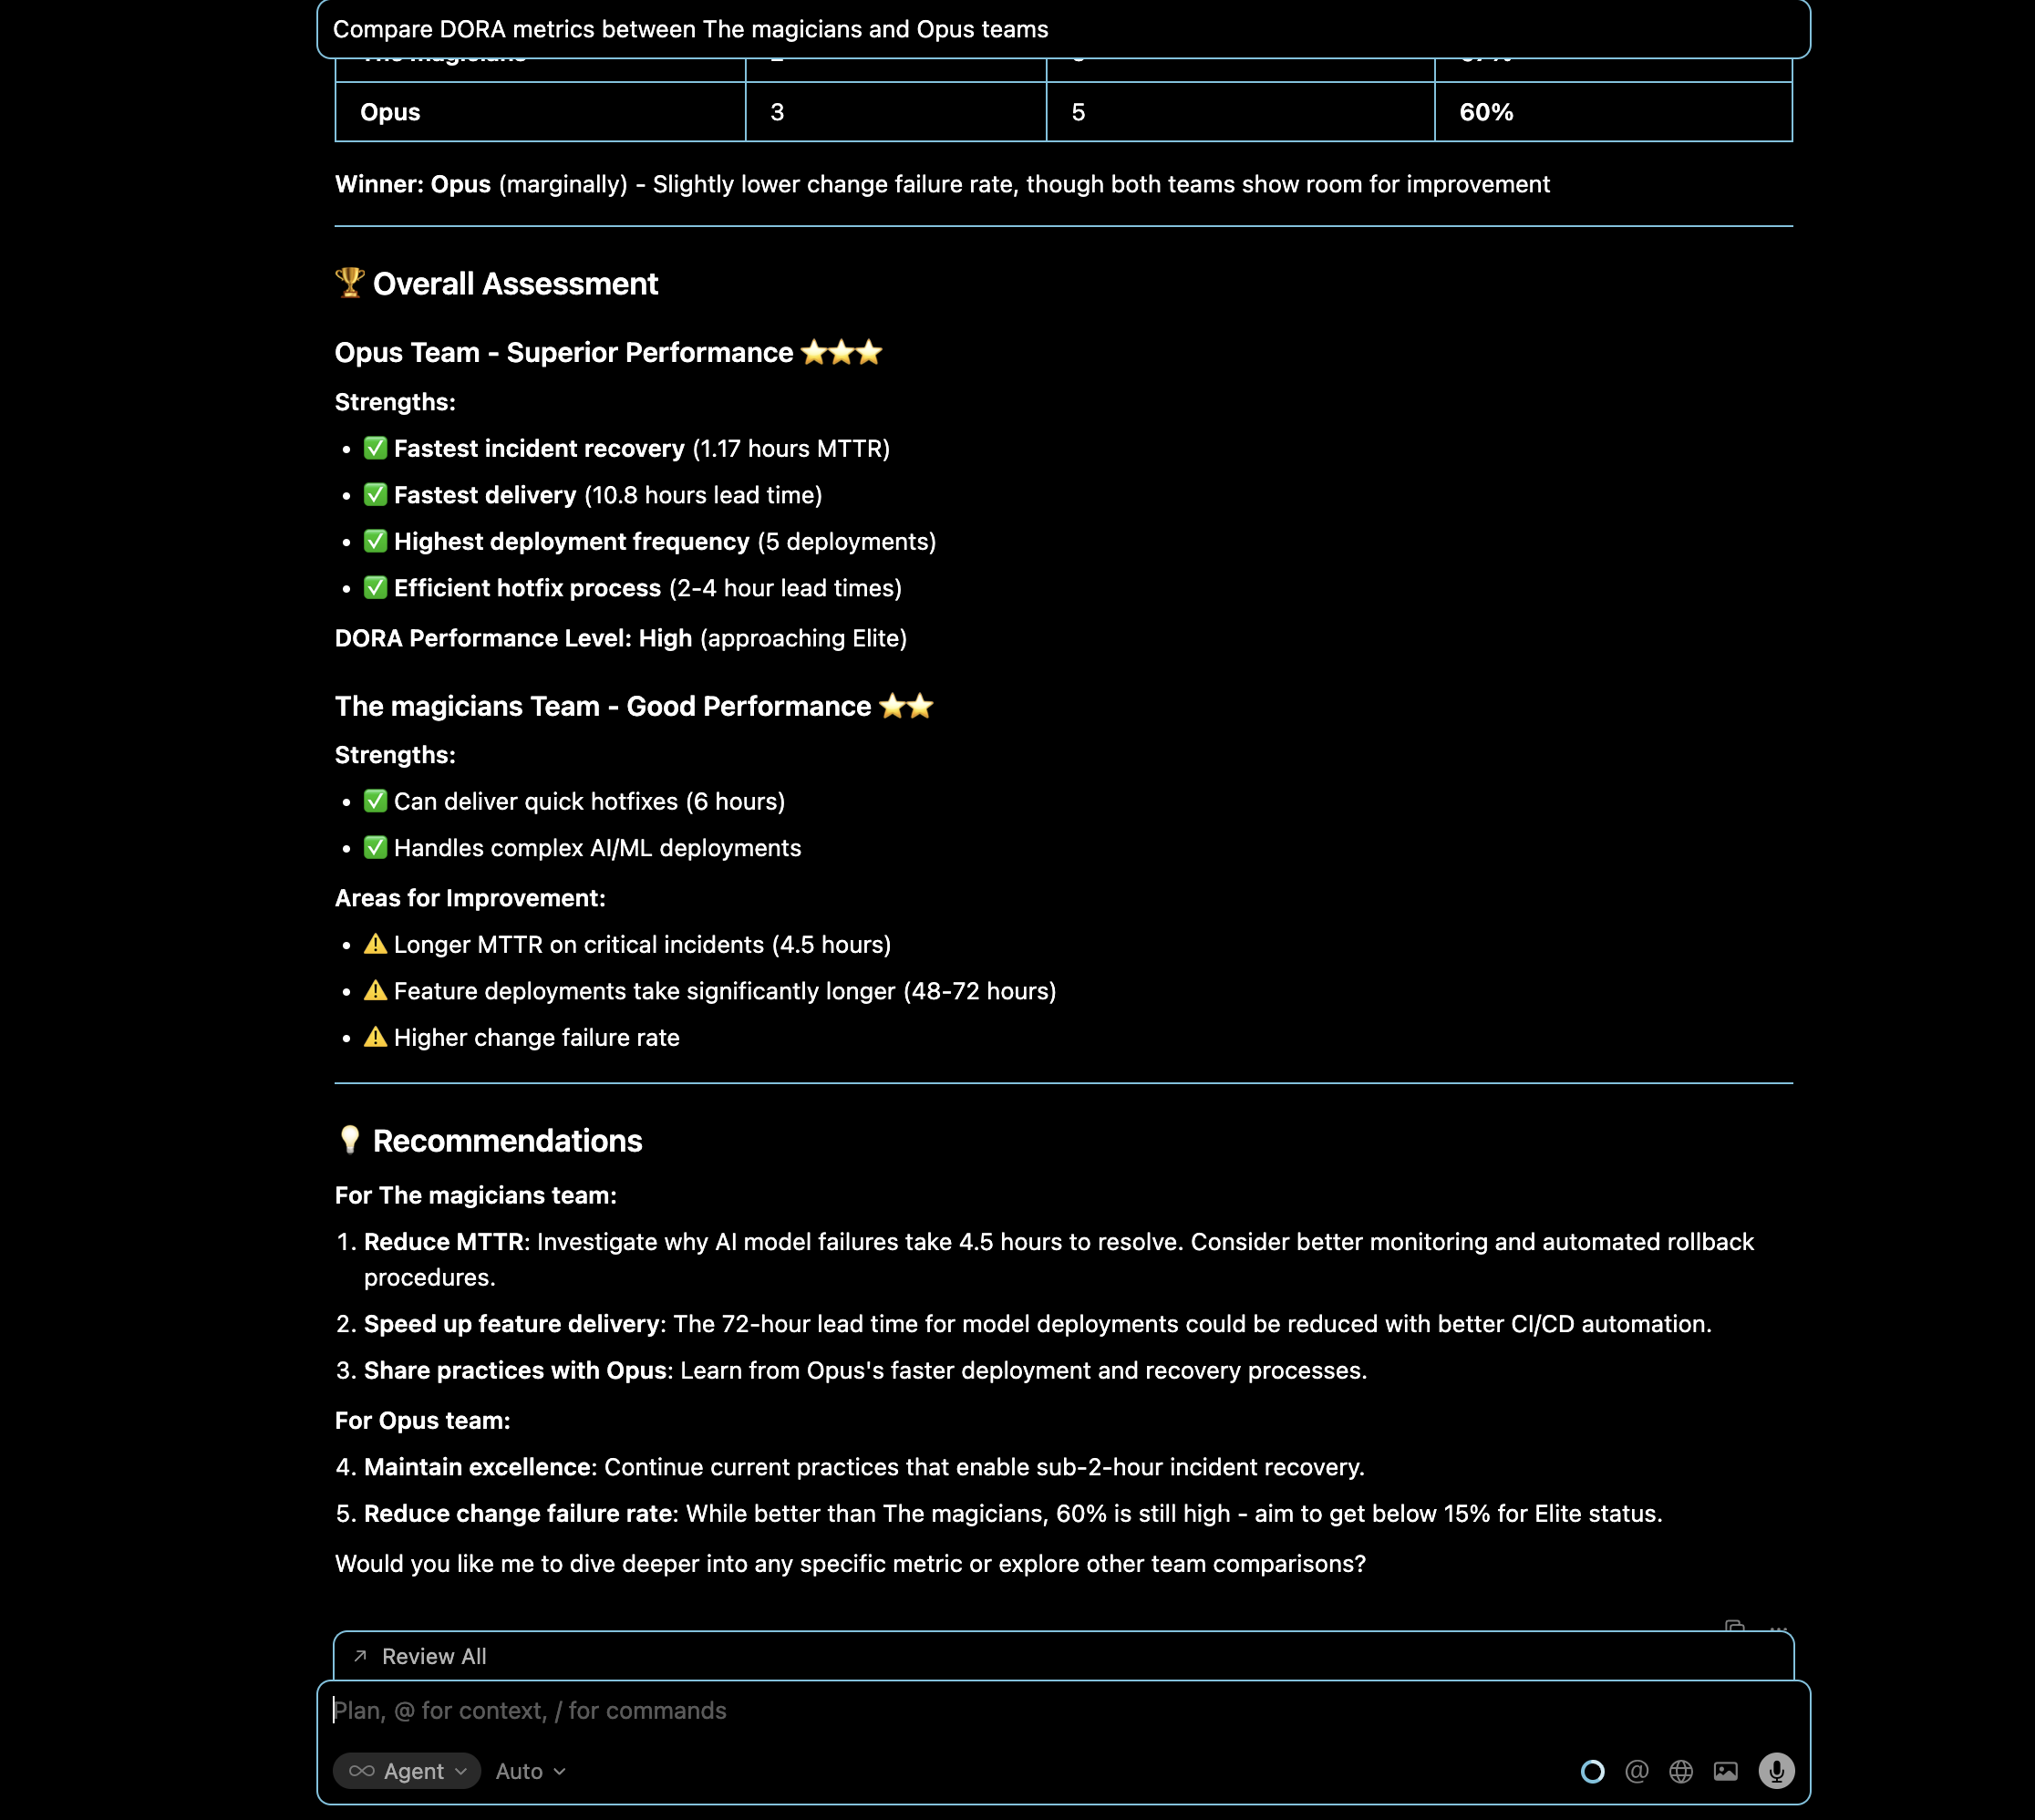
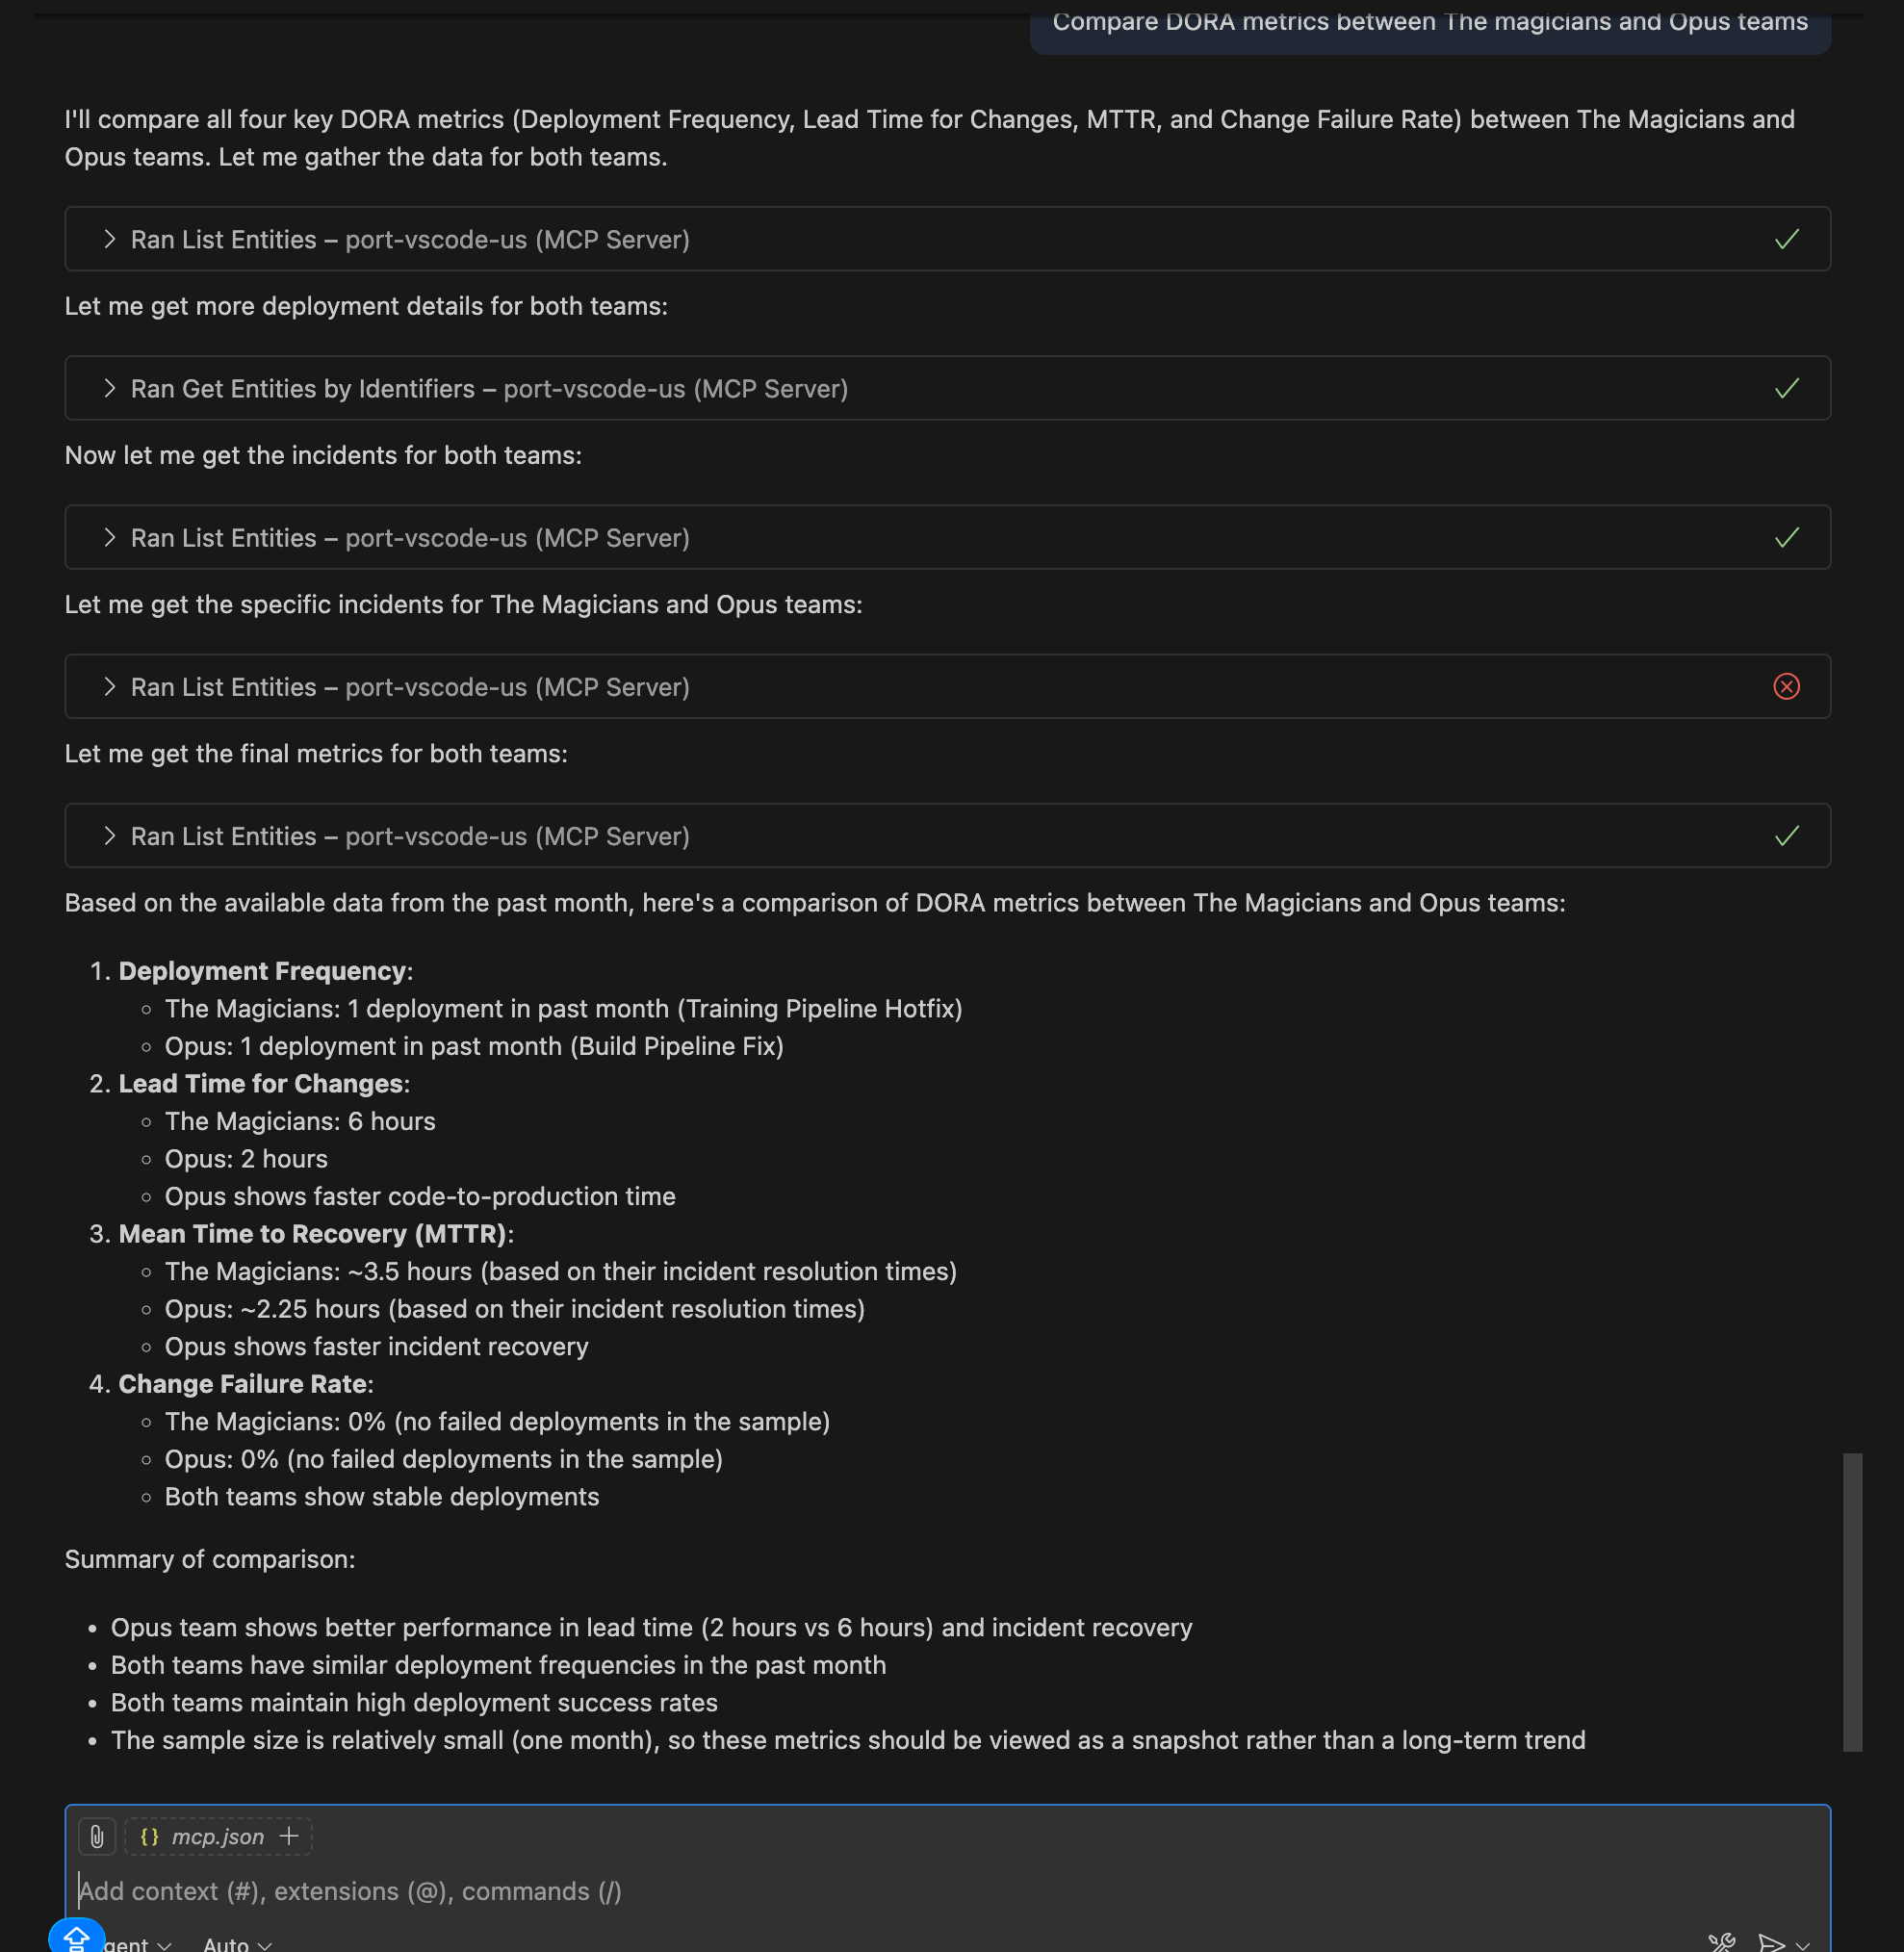
Query: "Compare DORA metrics between The magicians and Opus teams"
Compare deployment frequency, lead time, and incident metrics between two teams to identify performance differences and opportunities to share best practices.
- Cursor IDE
- VS Code
Deployment analysis
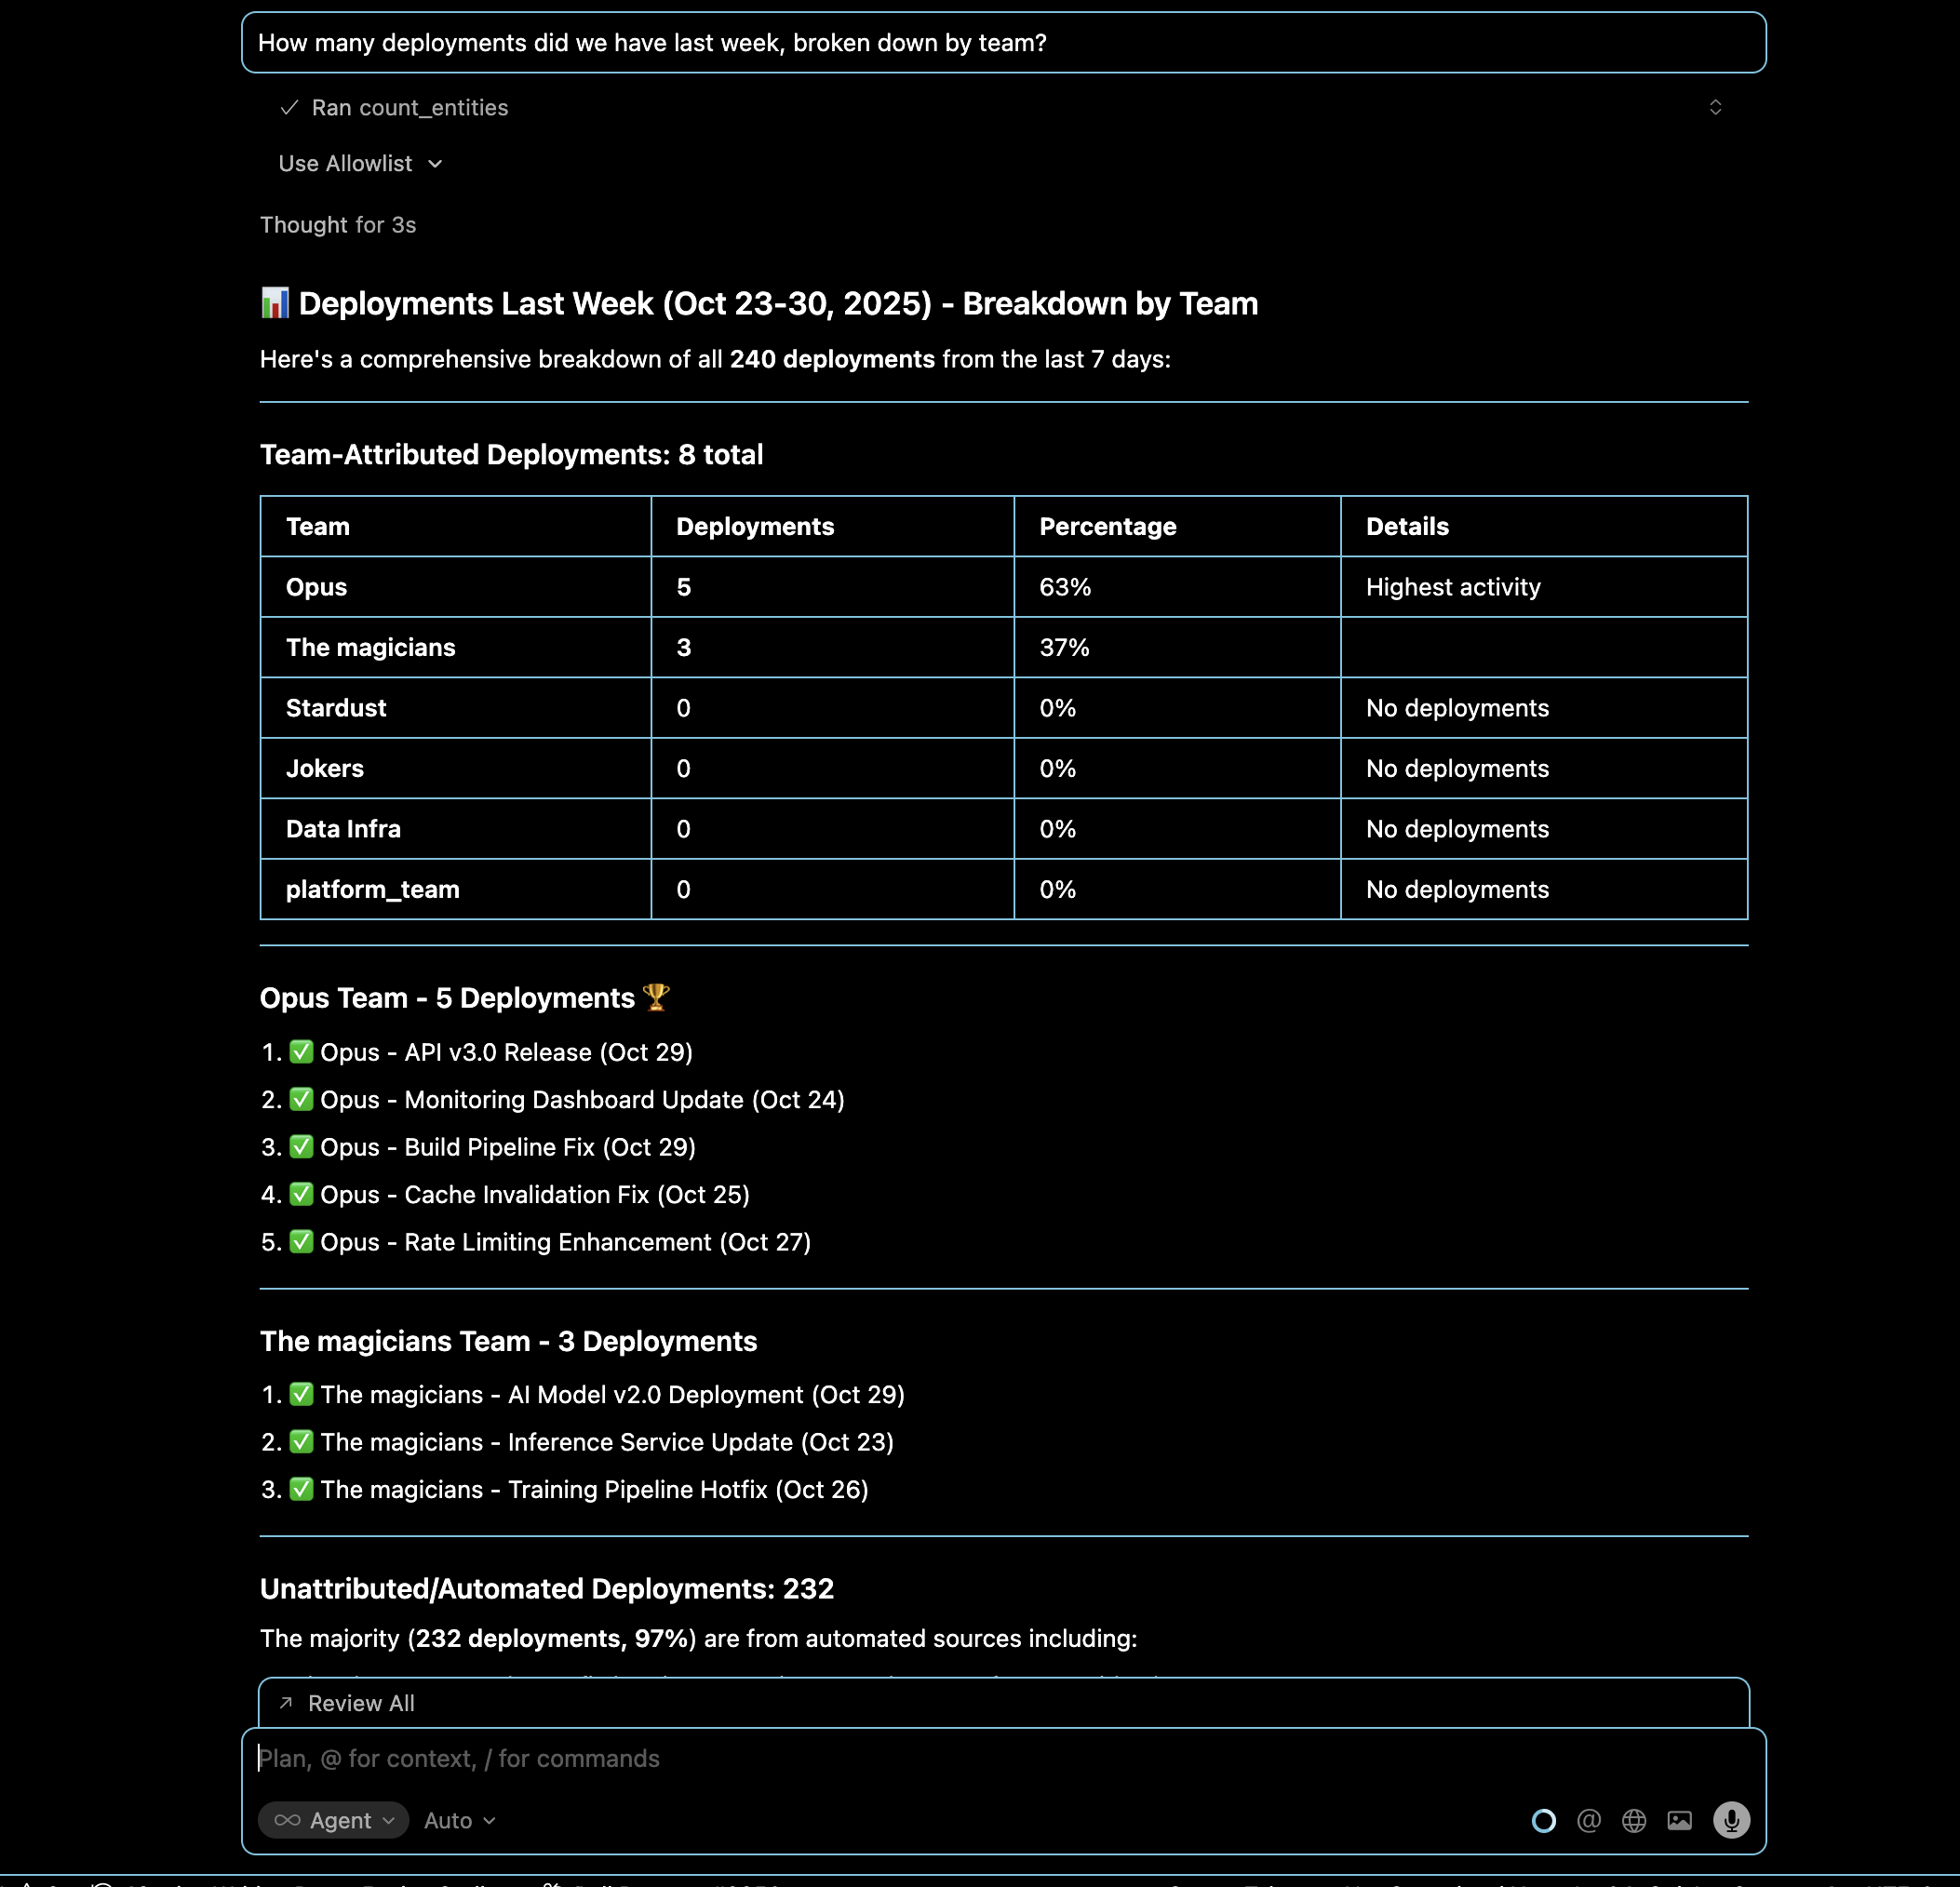
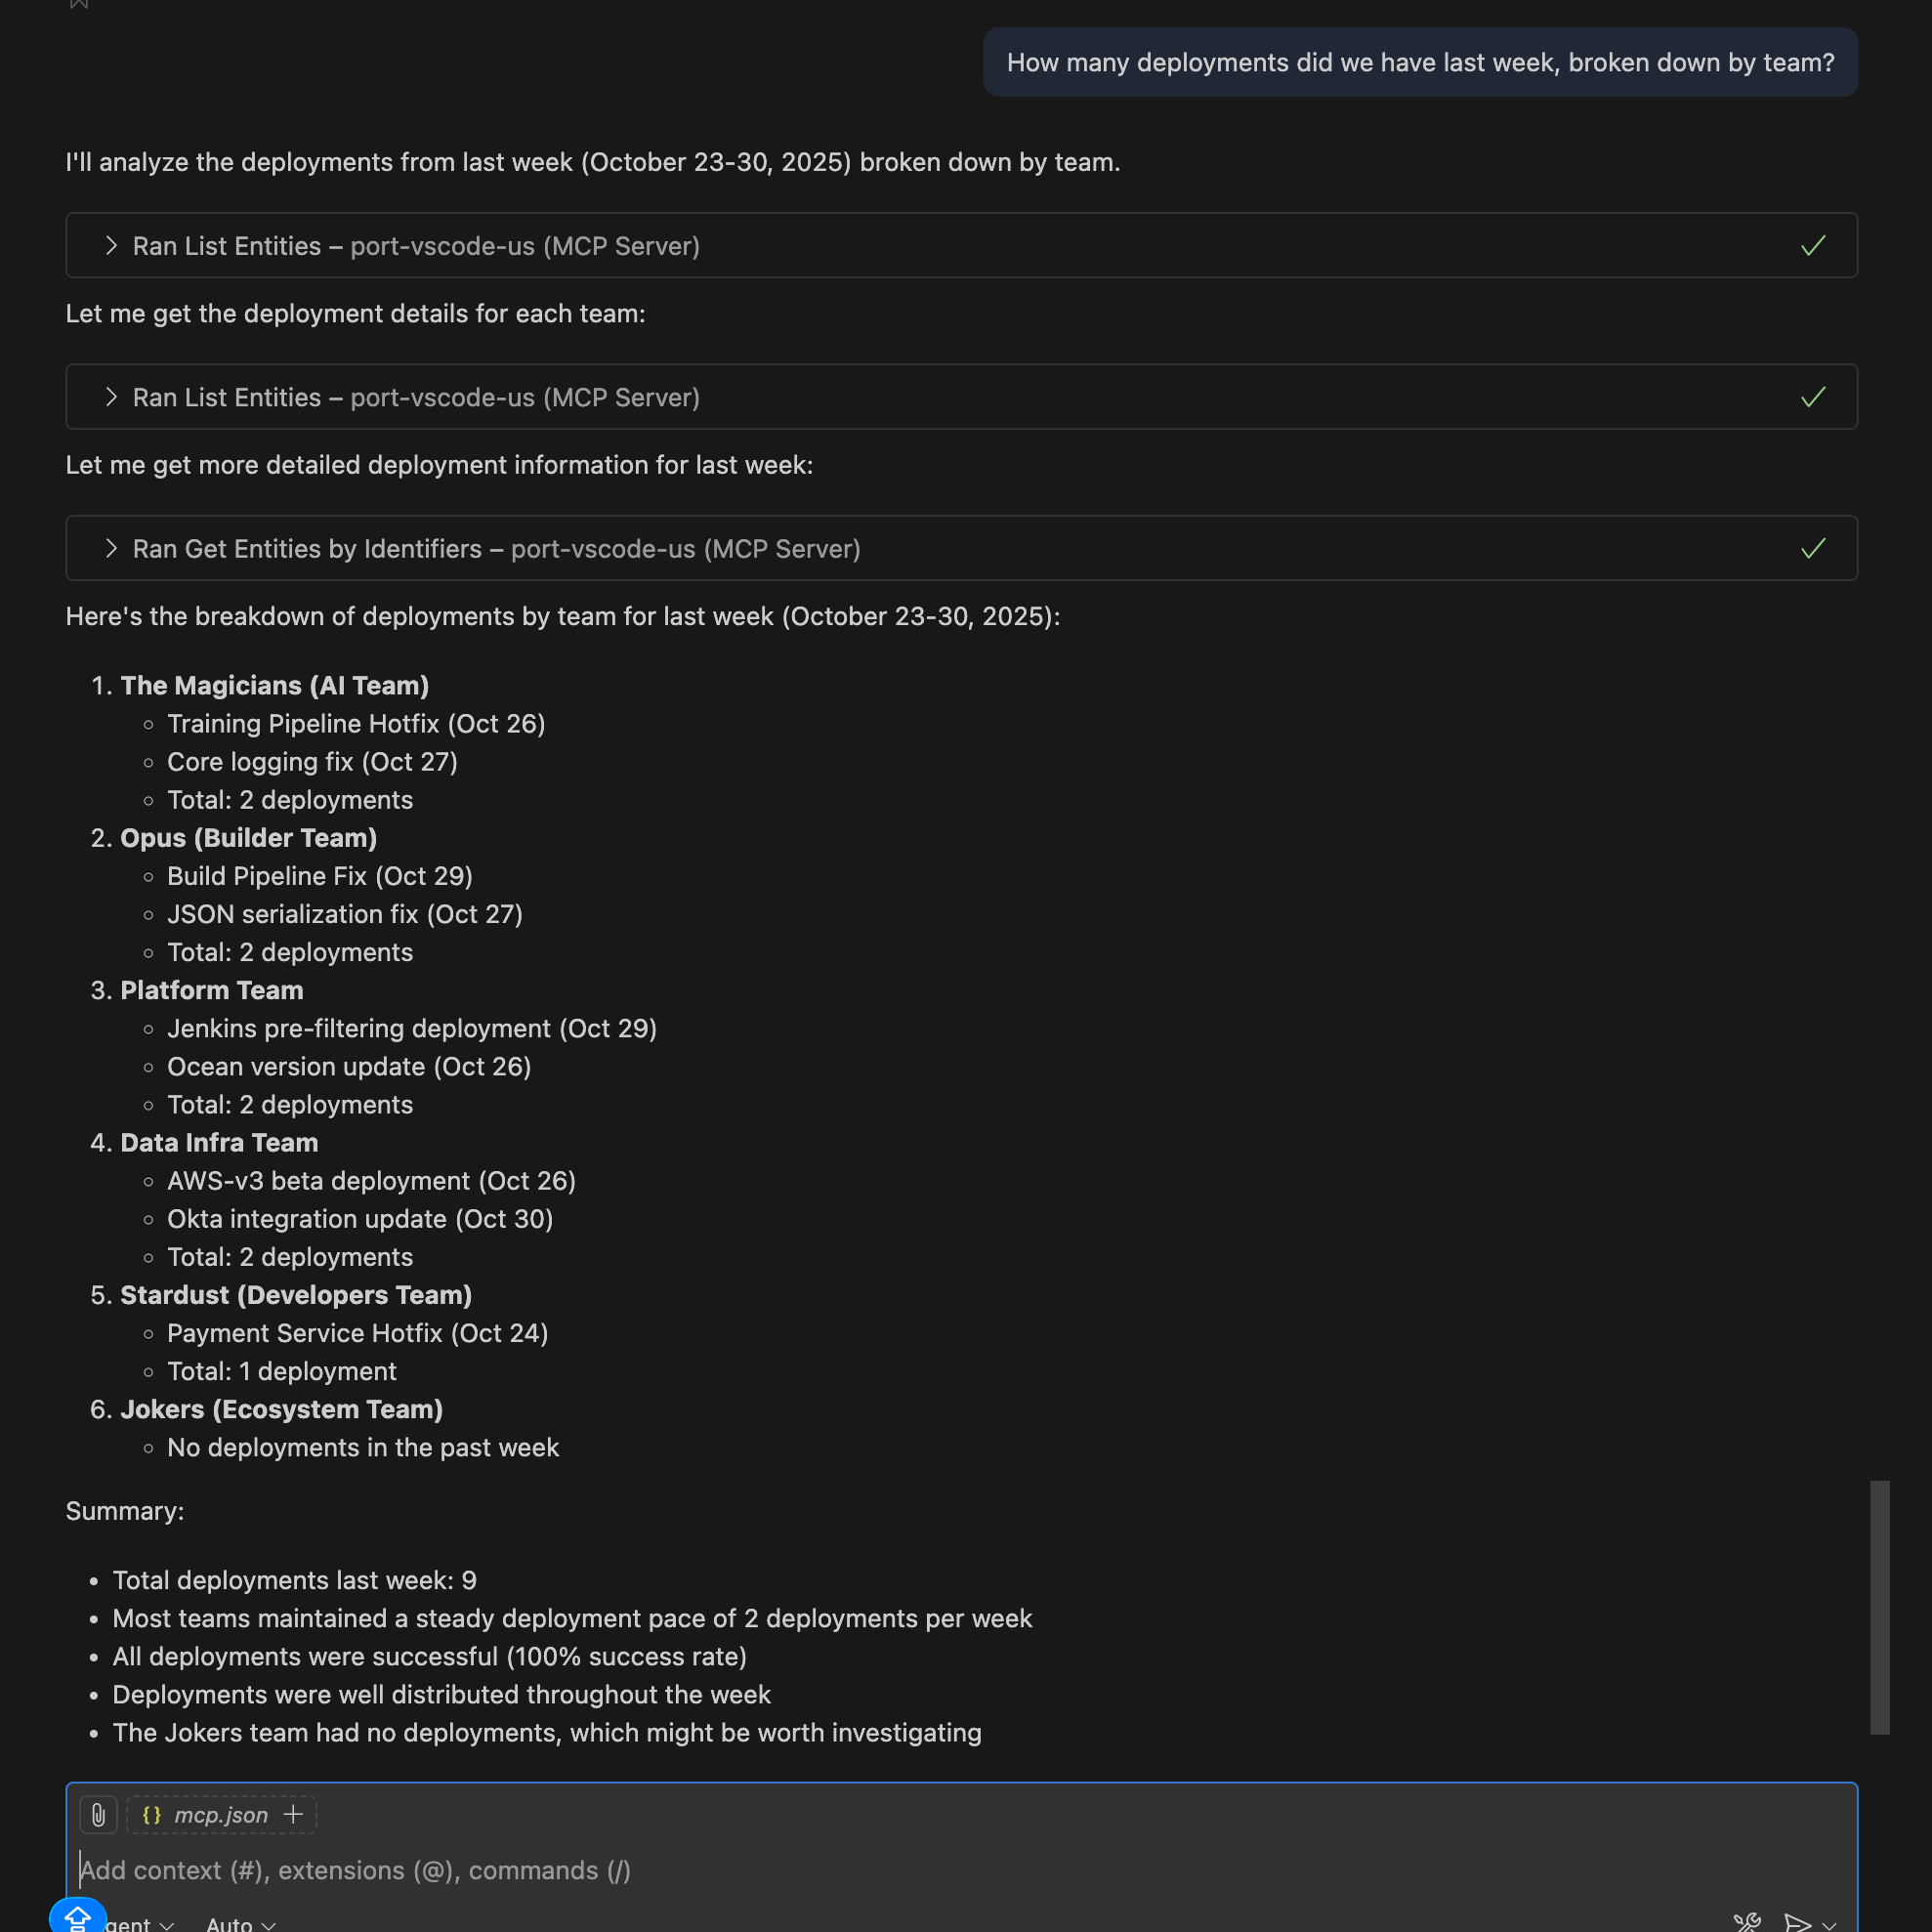
Query: "How many deployments did we have last week, broken down by team?"
Get a comprehensive view of deployment activity across all teams to understand deployment frequency patterns.
- Cursor IDE
- VS Code
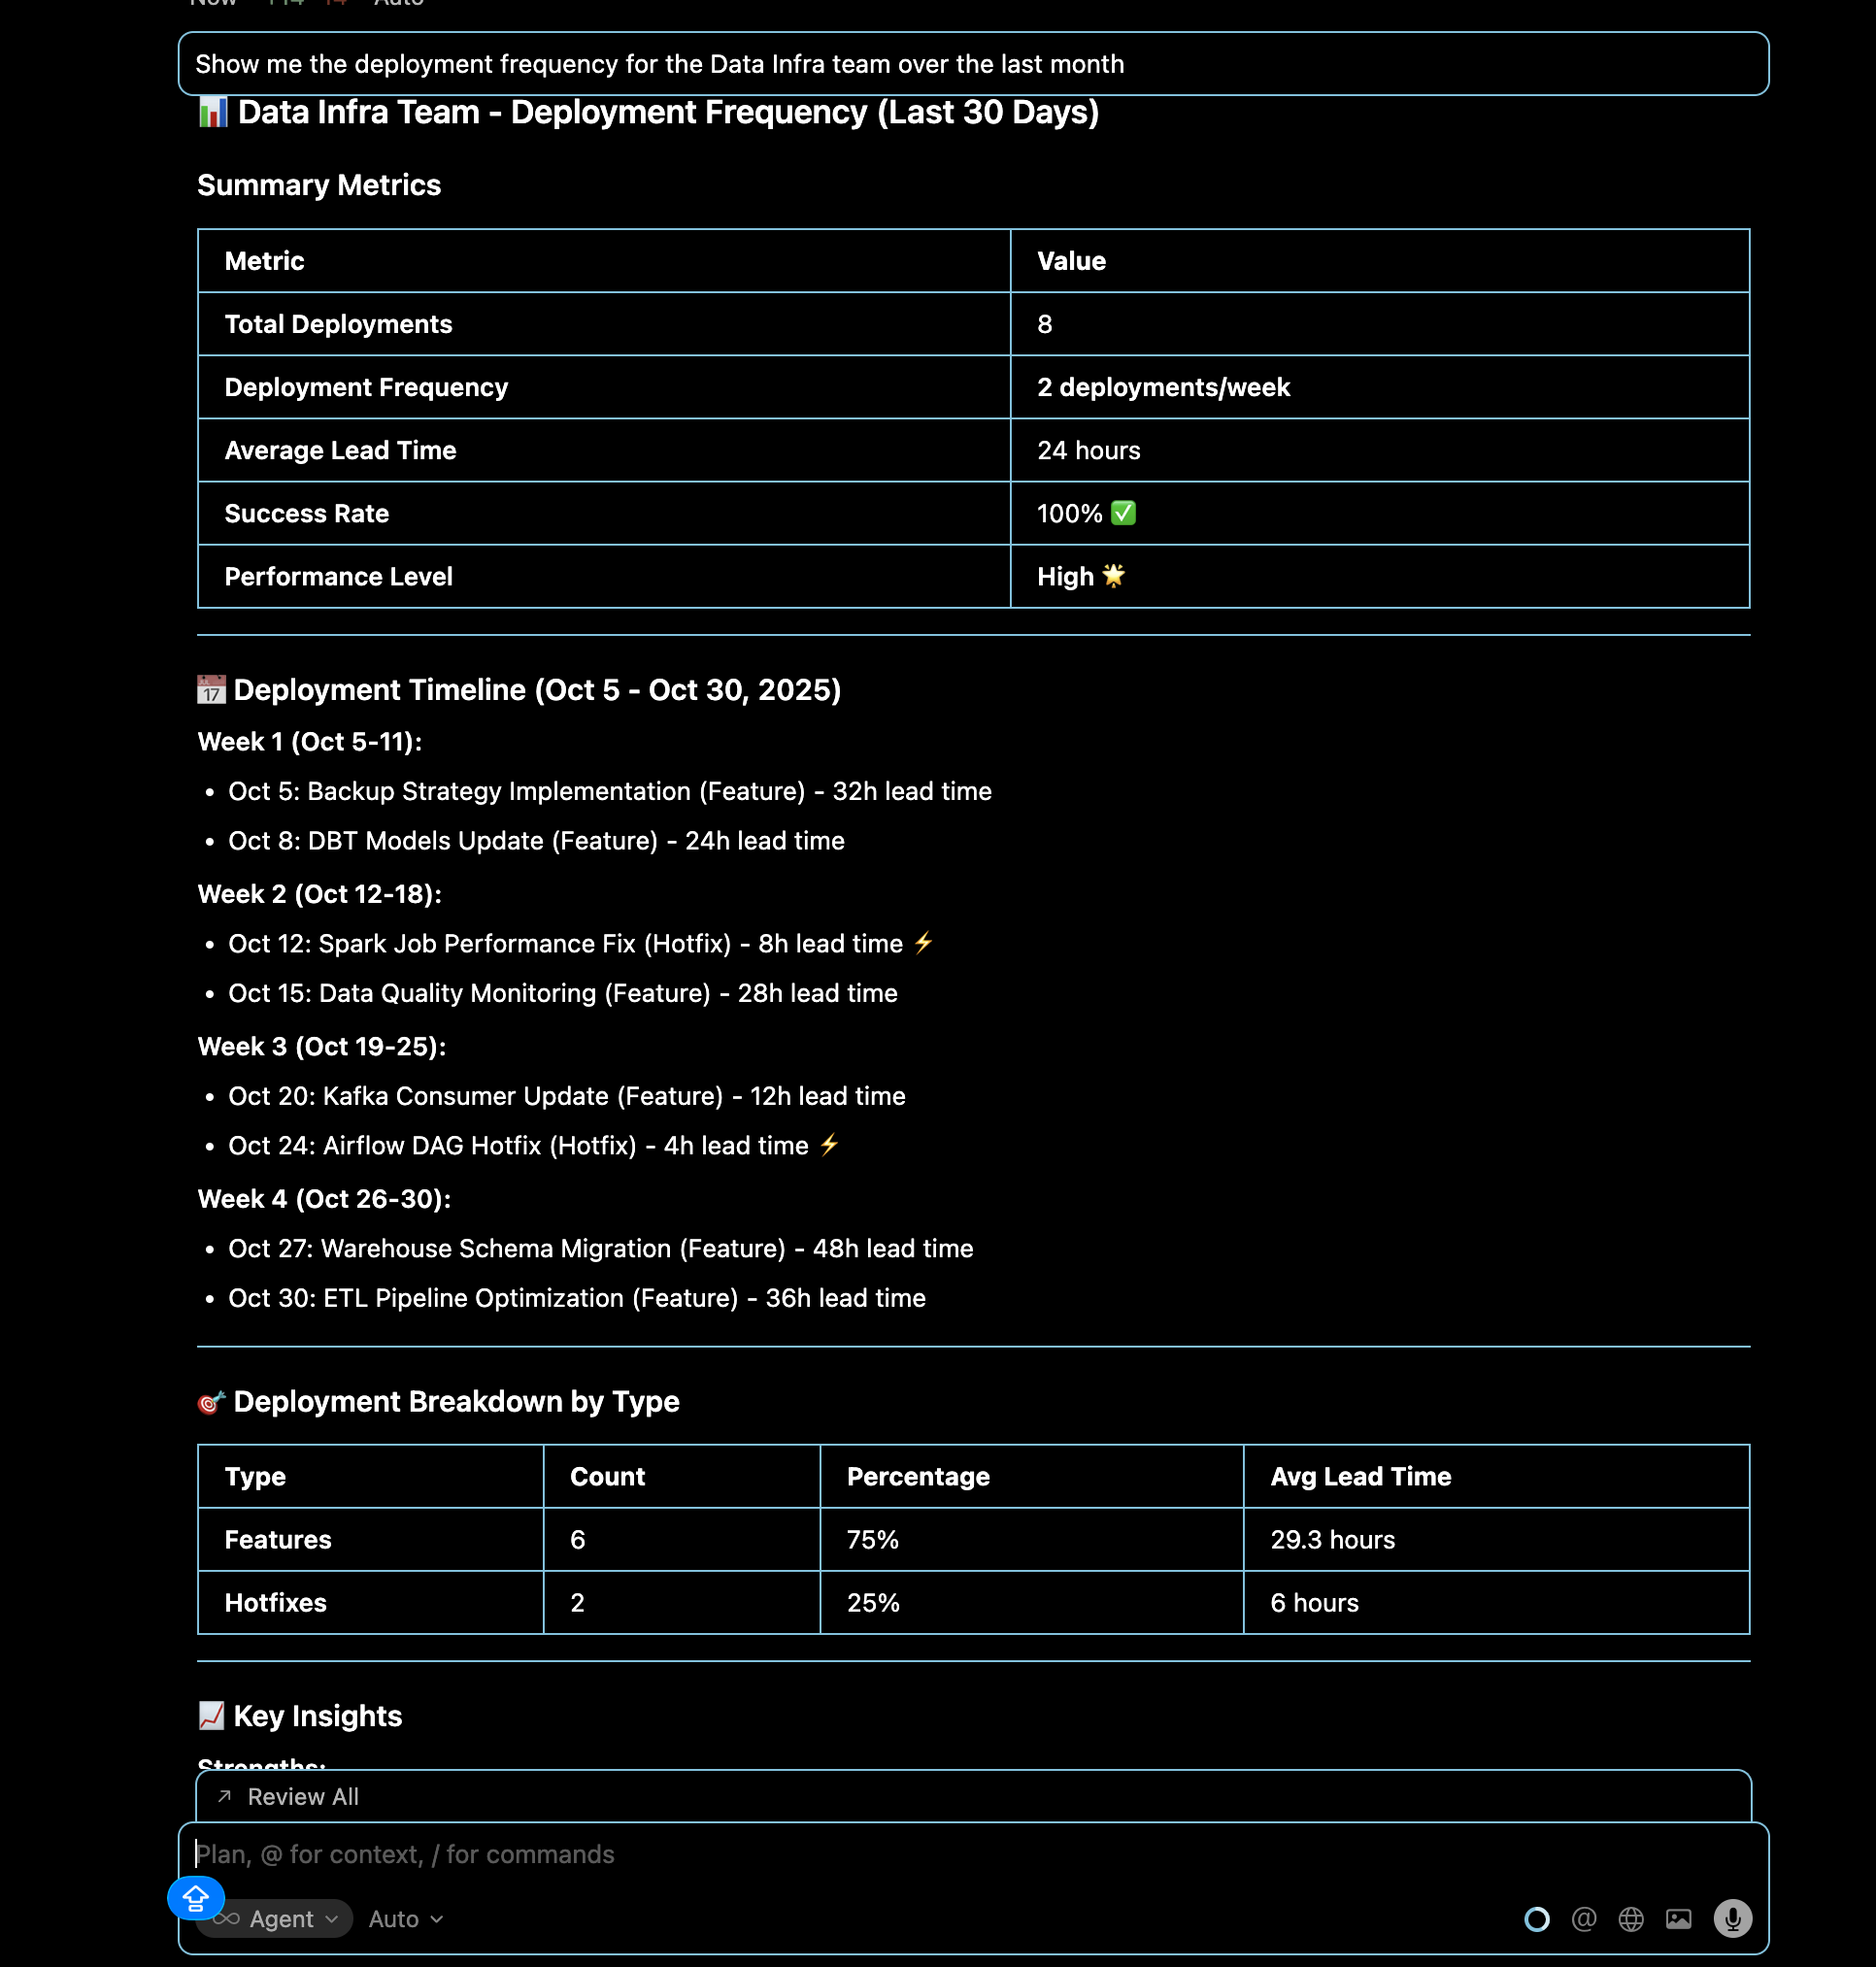
Query: "Show me the deployment frequency for the Data Infra team over the last month"
Analyze deployment patterns for a specific team to understand their release cadence and velocity trends.
- Cursor IDE
- VS Code

Change failure rate analysis
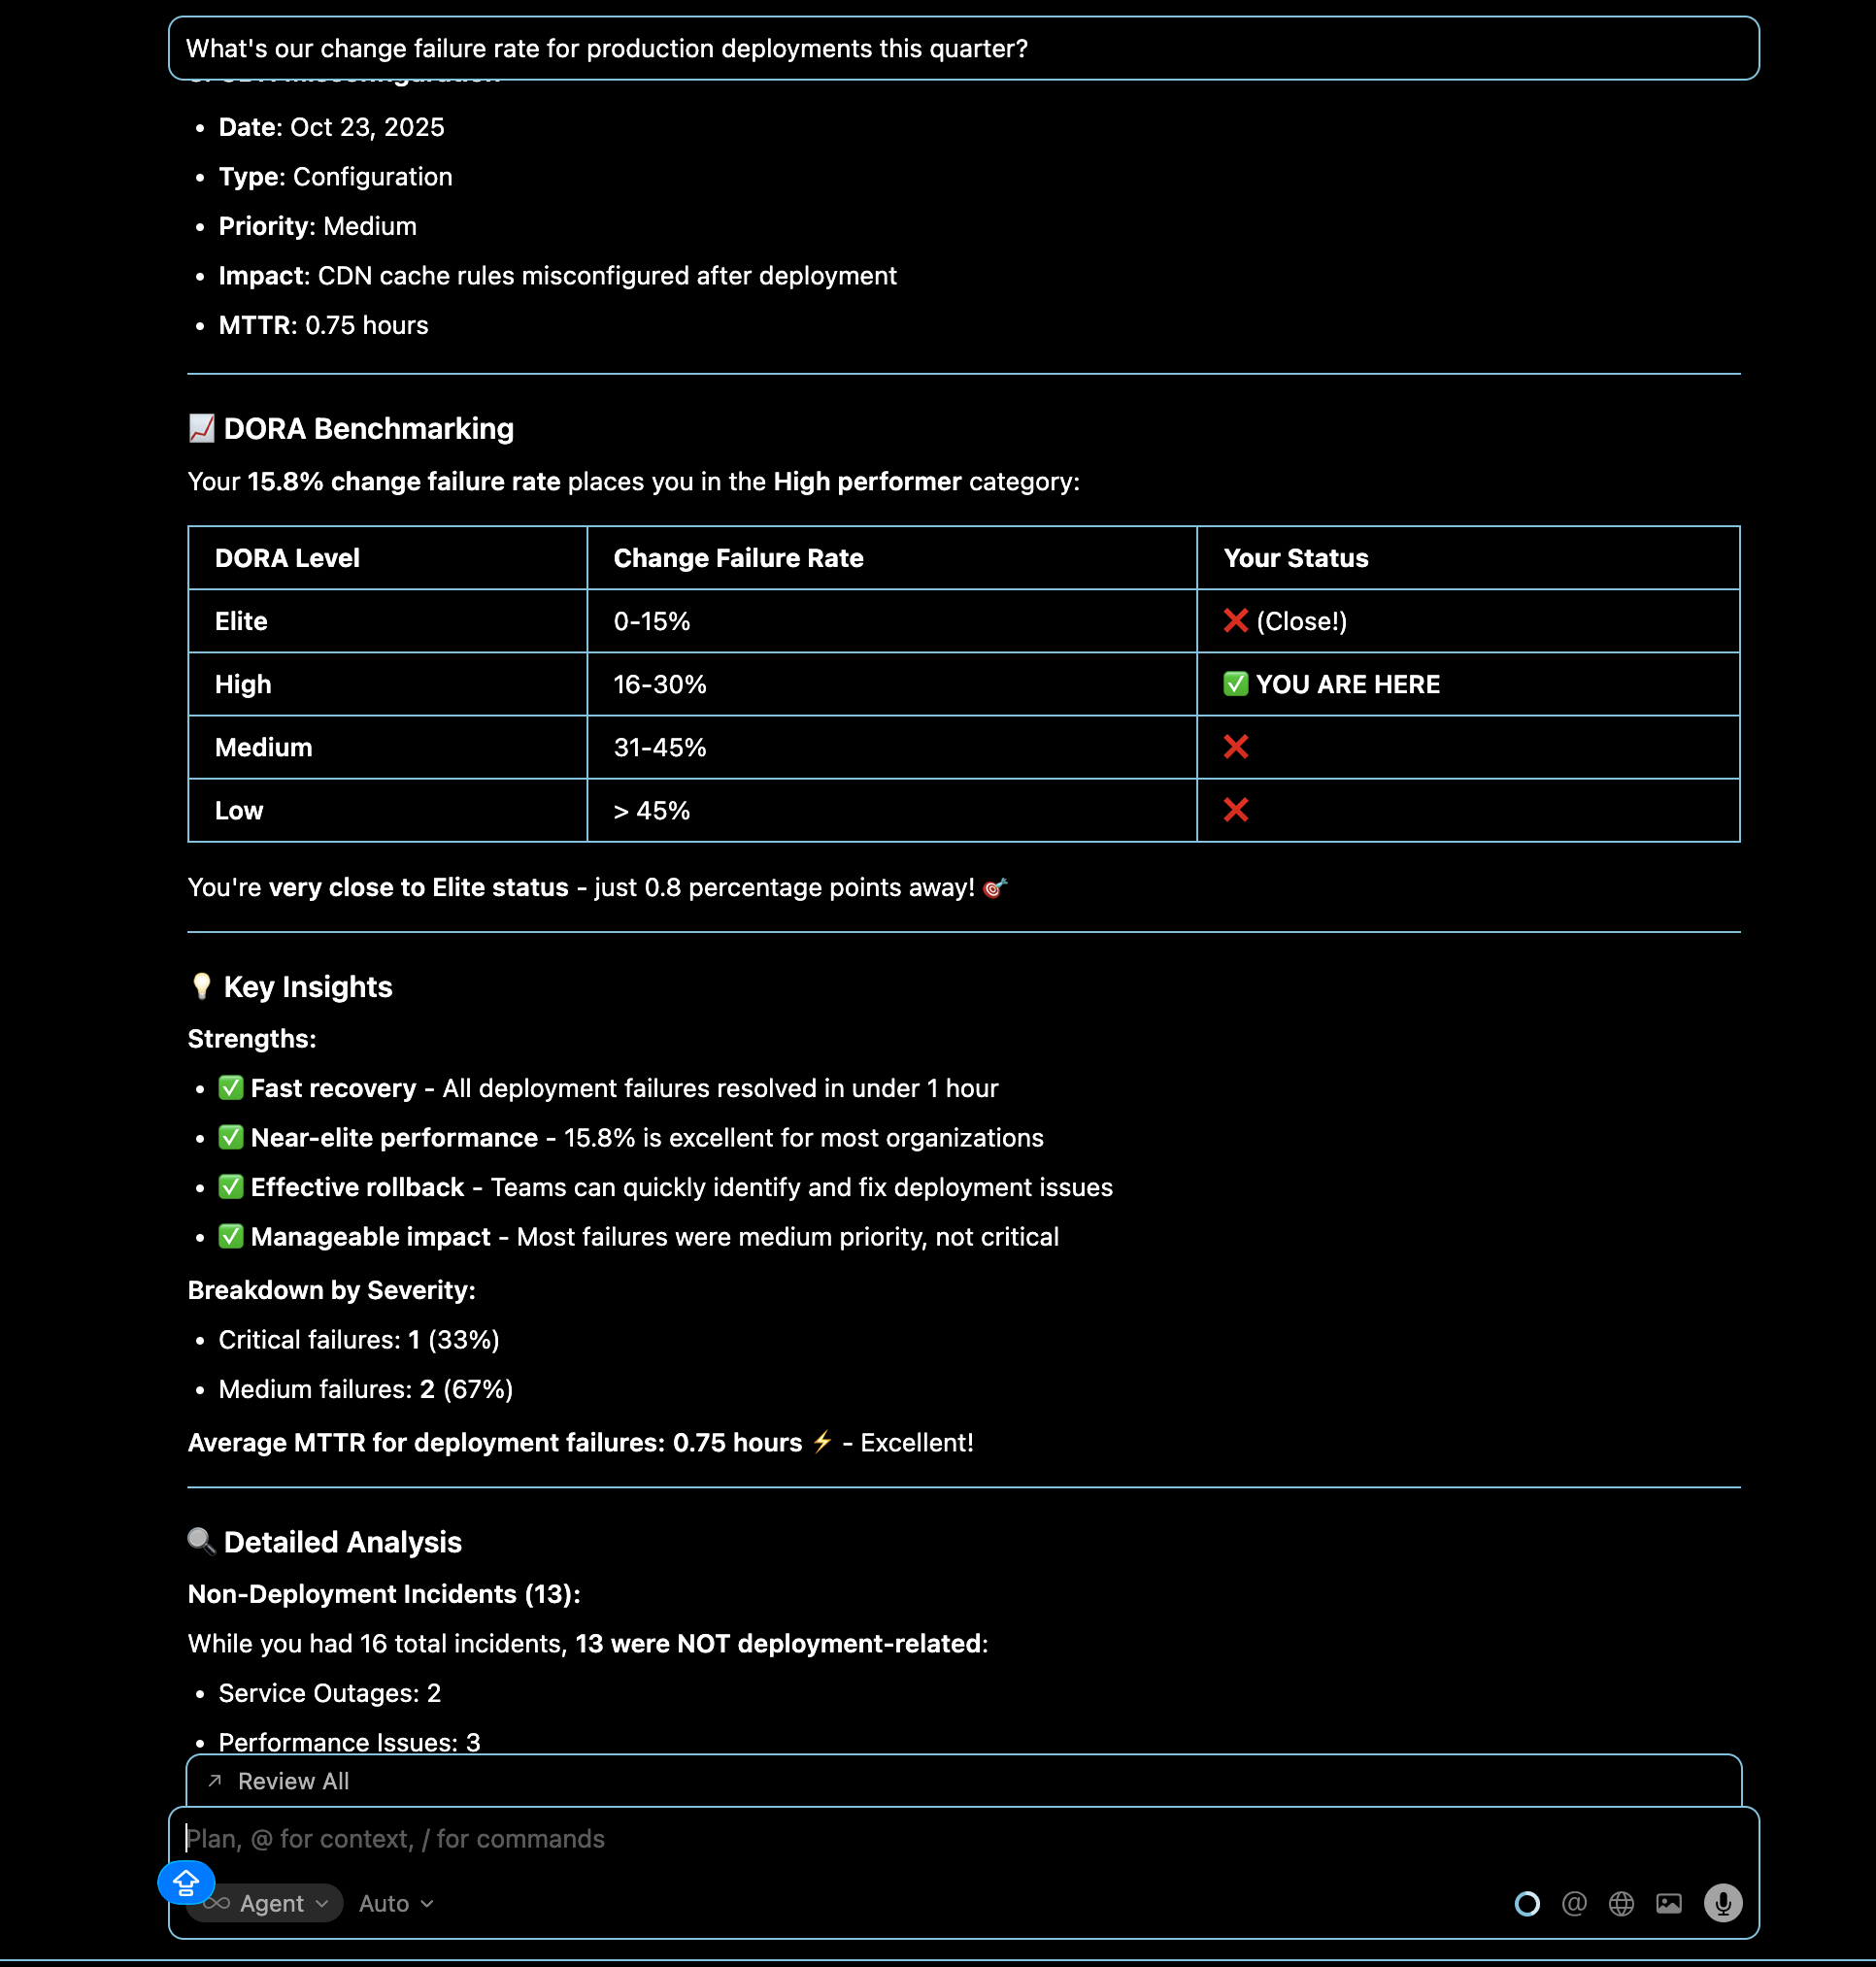
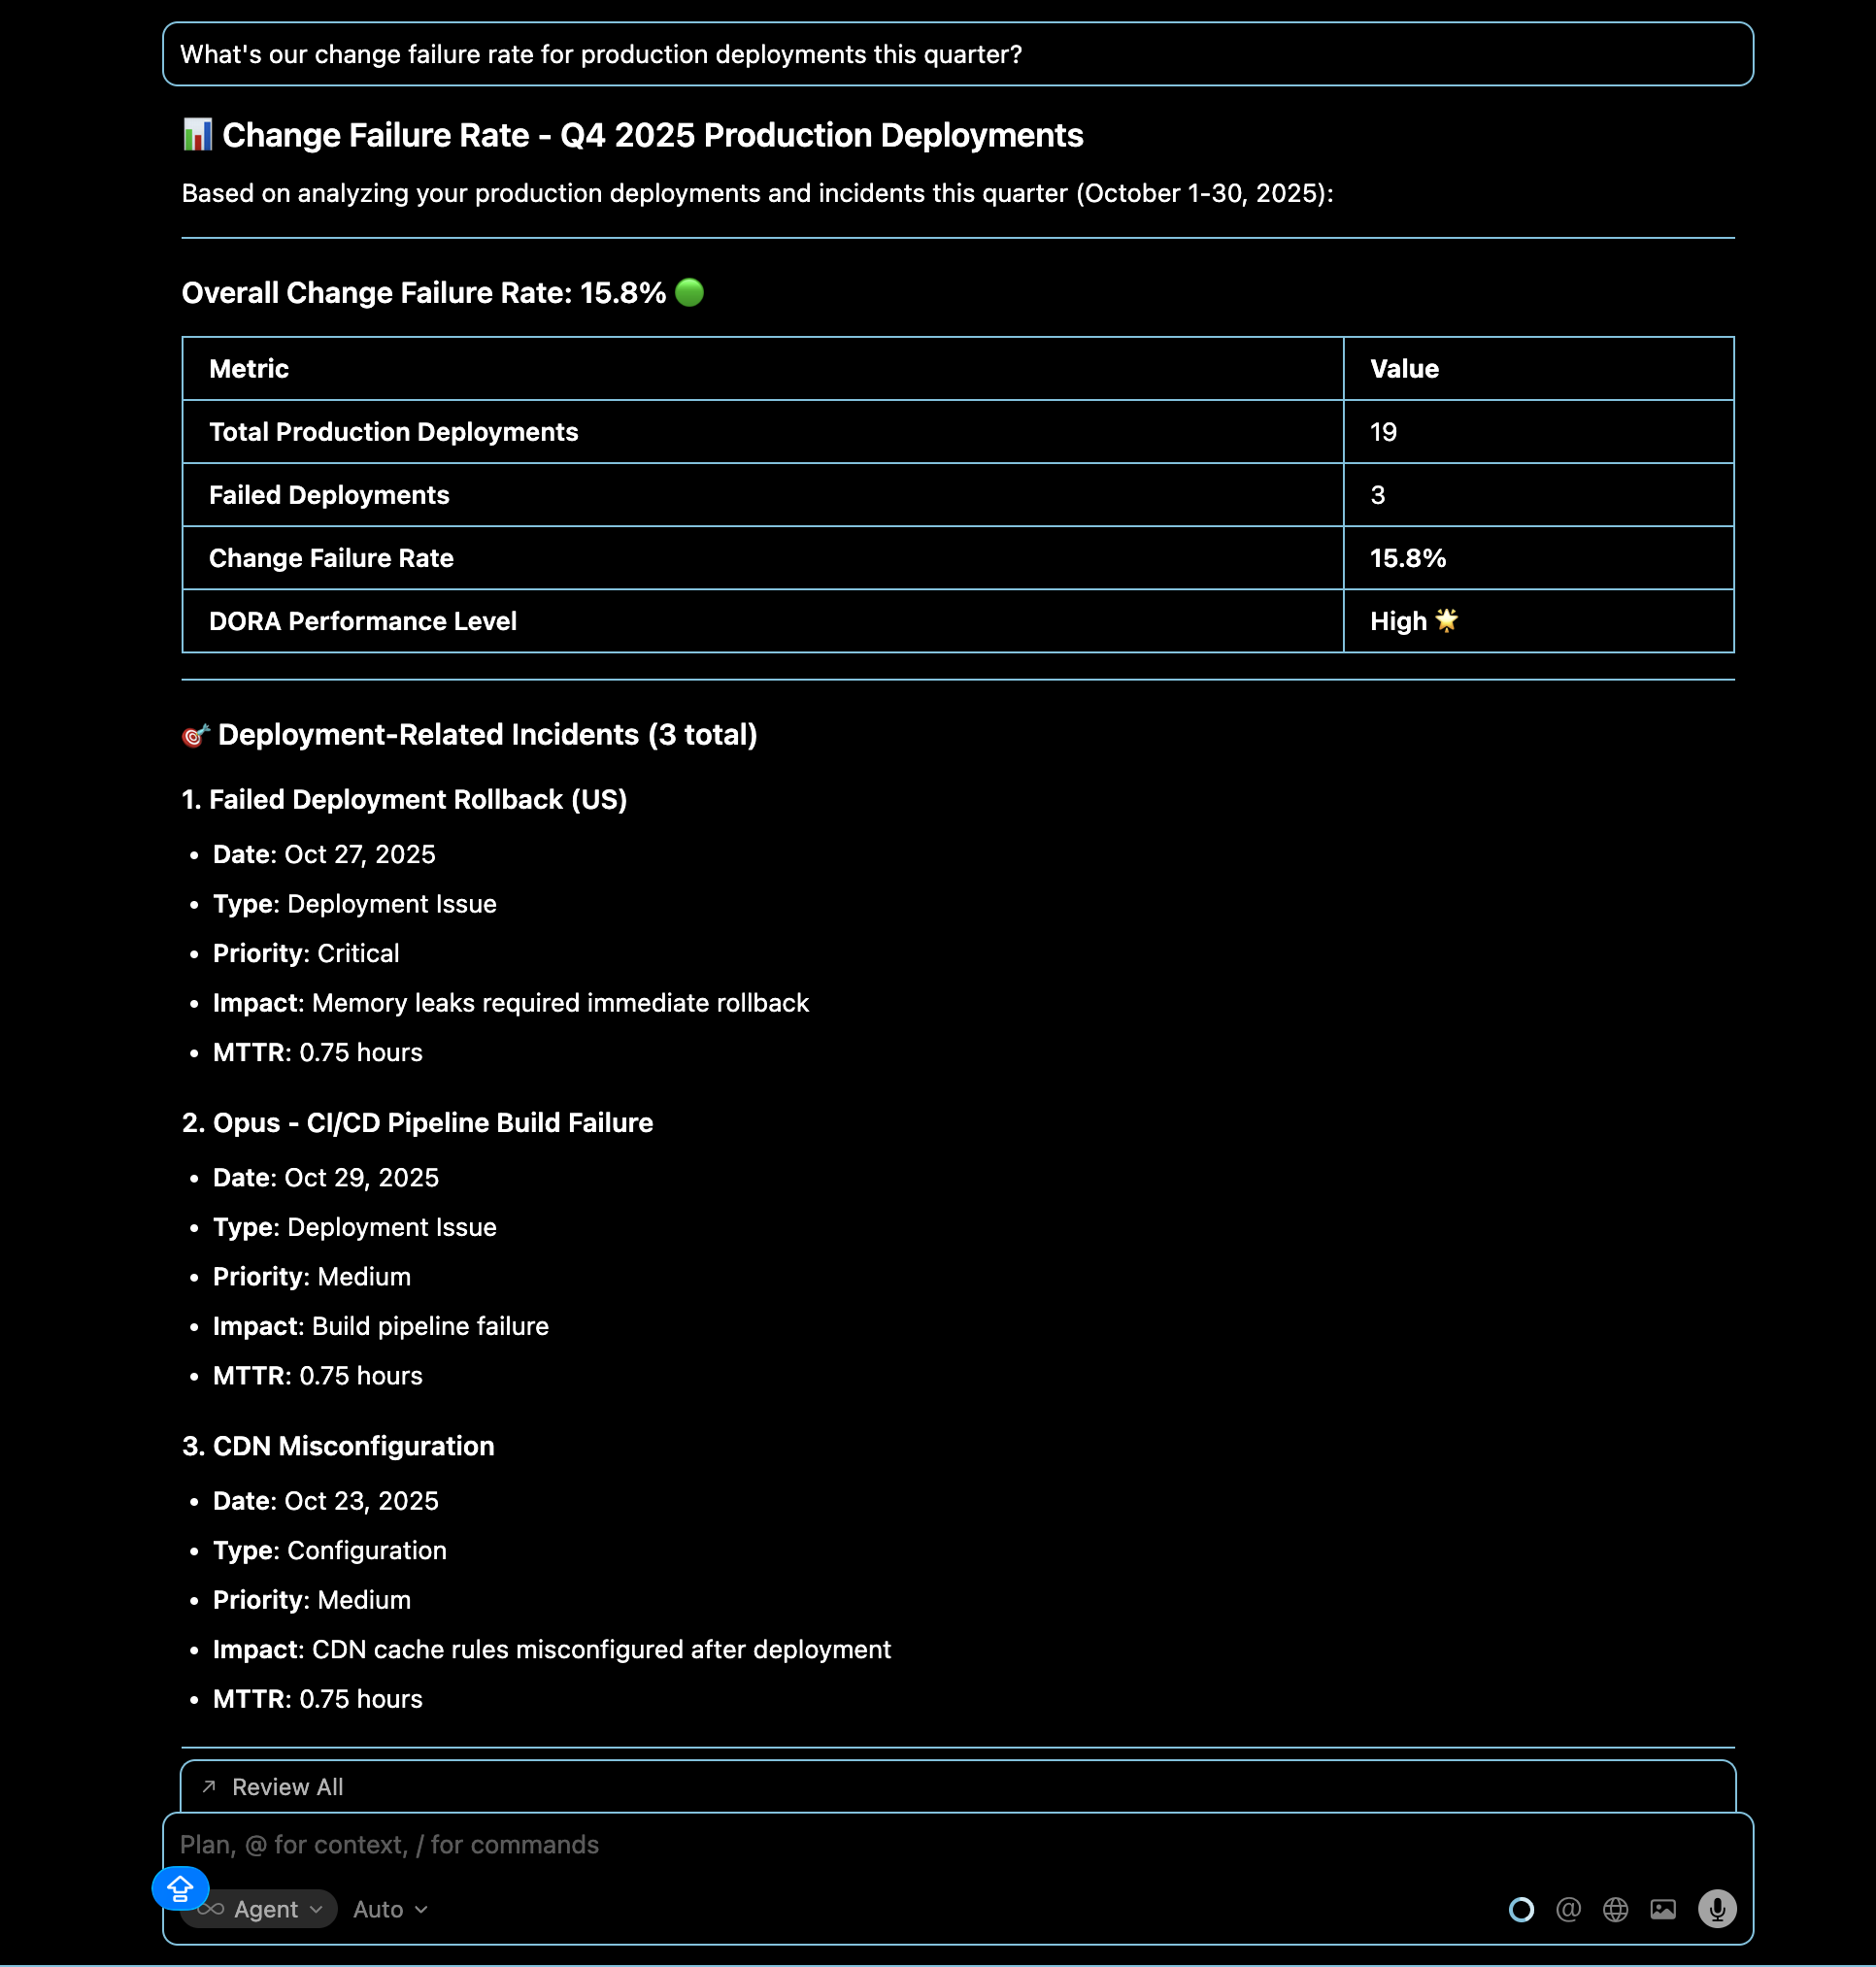
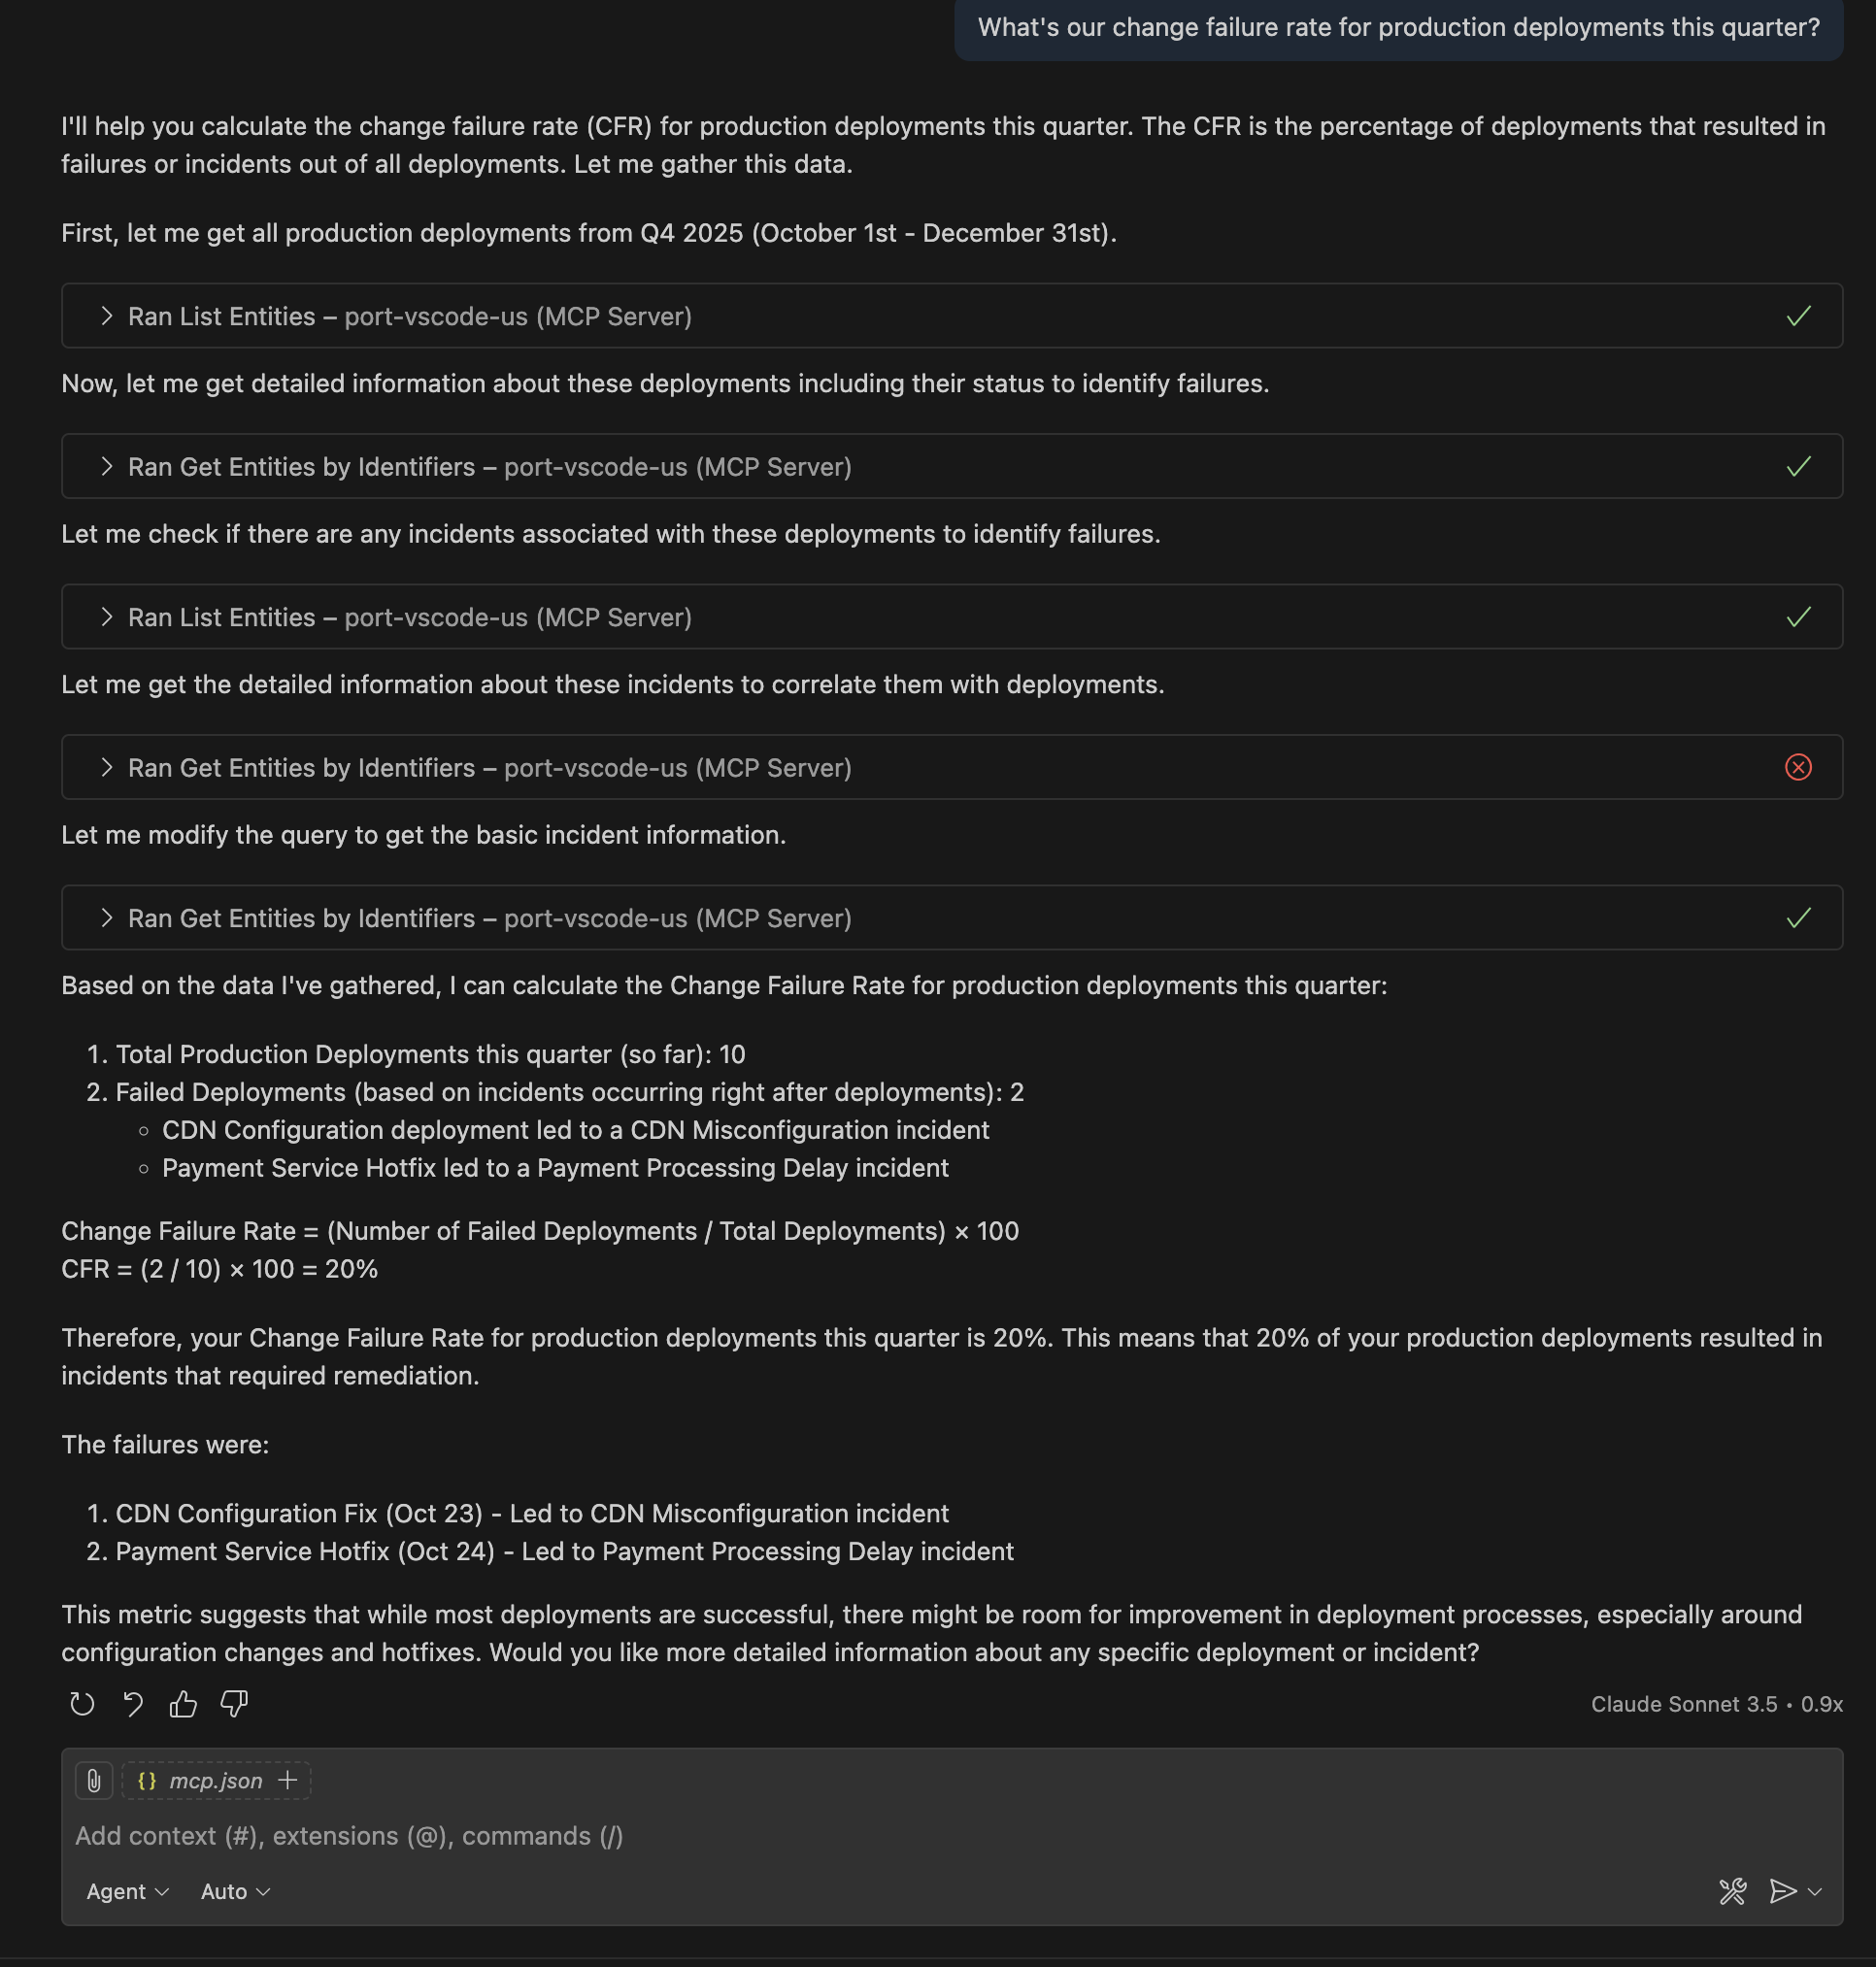
Query: "What's our change failure rate for production deployments this quarter?"
Monitor the percentage of deployments that result in failures, helping assess deployment quality and process effectiveness.
- Cursor IDE
- VS Code
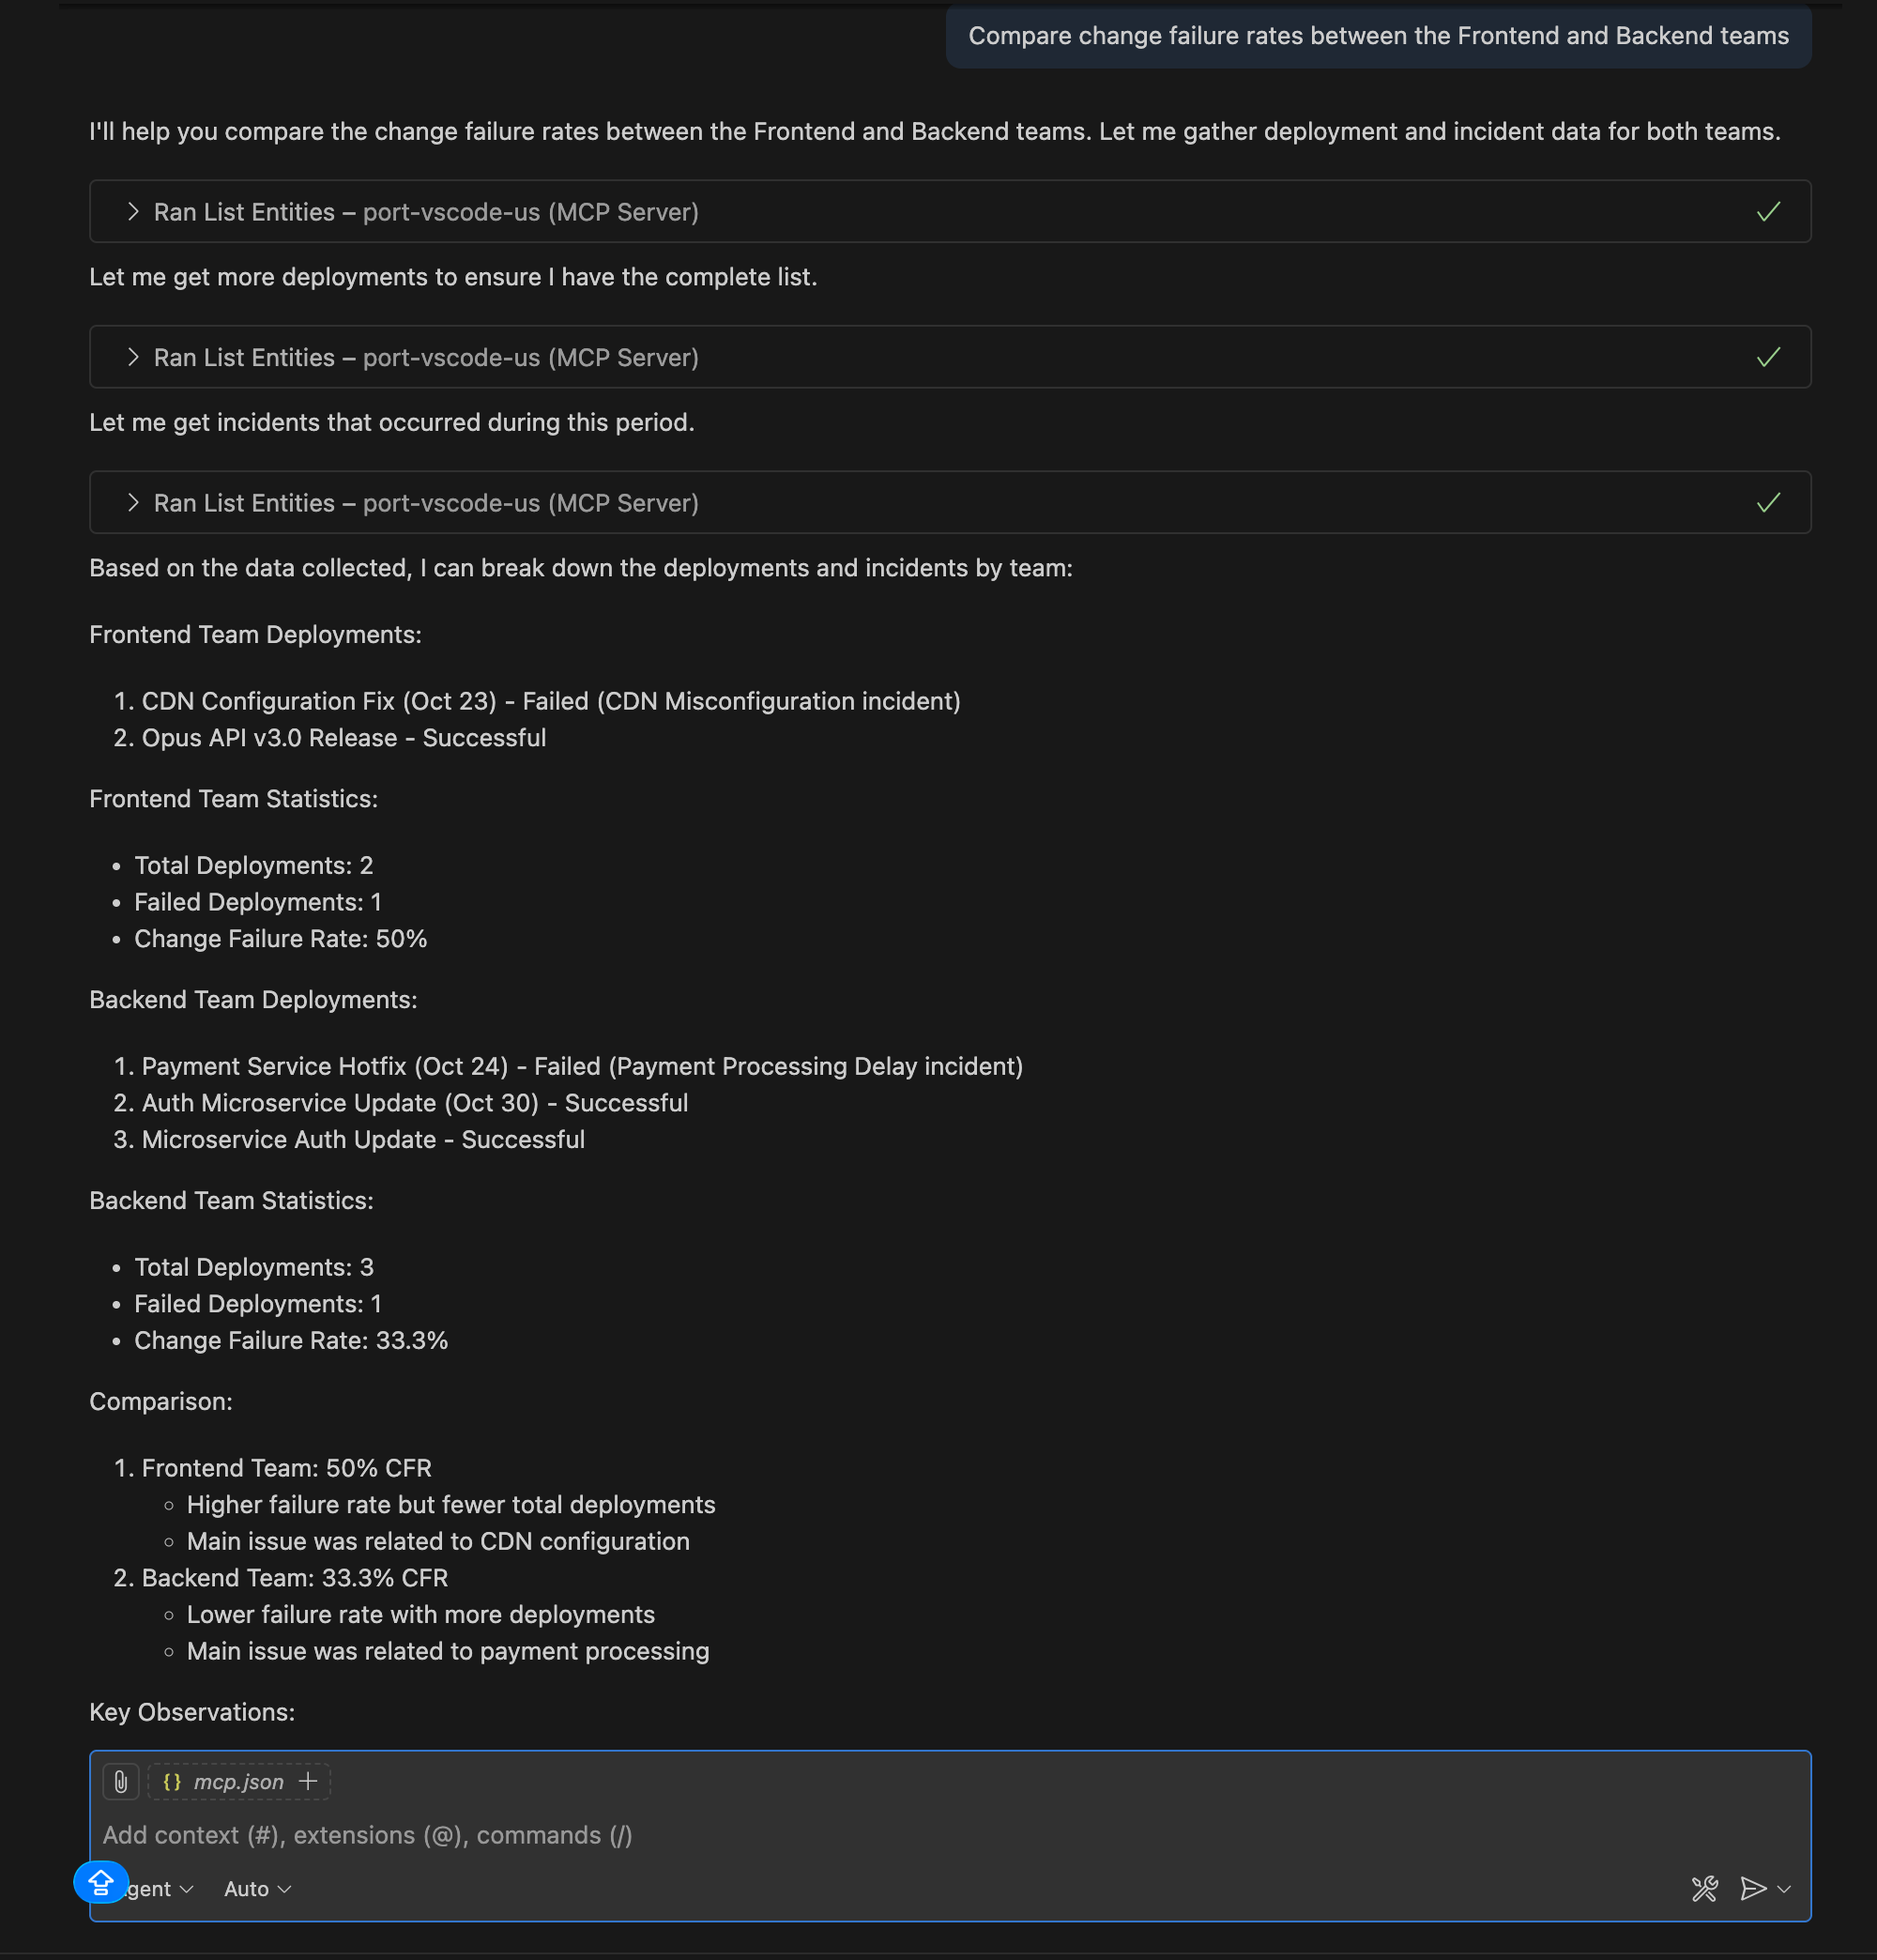
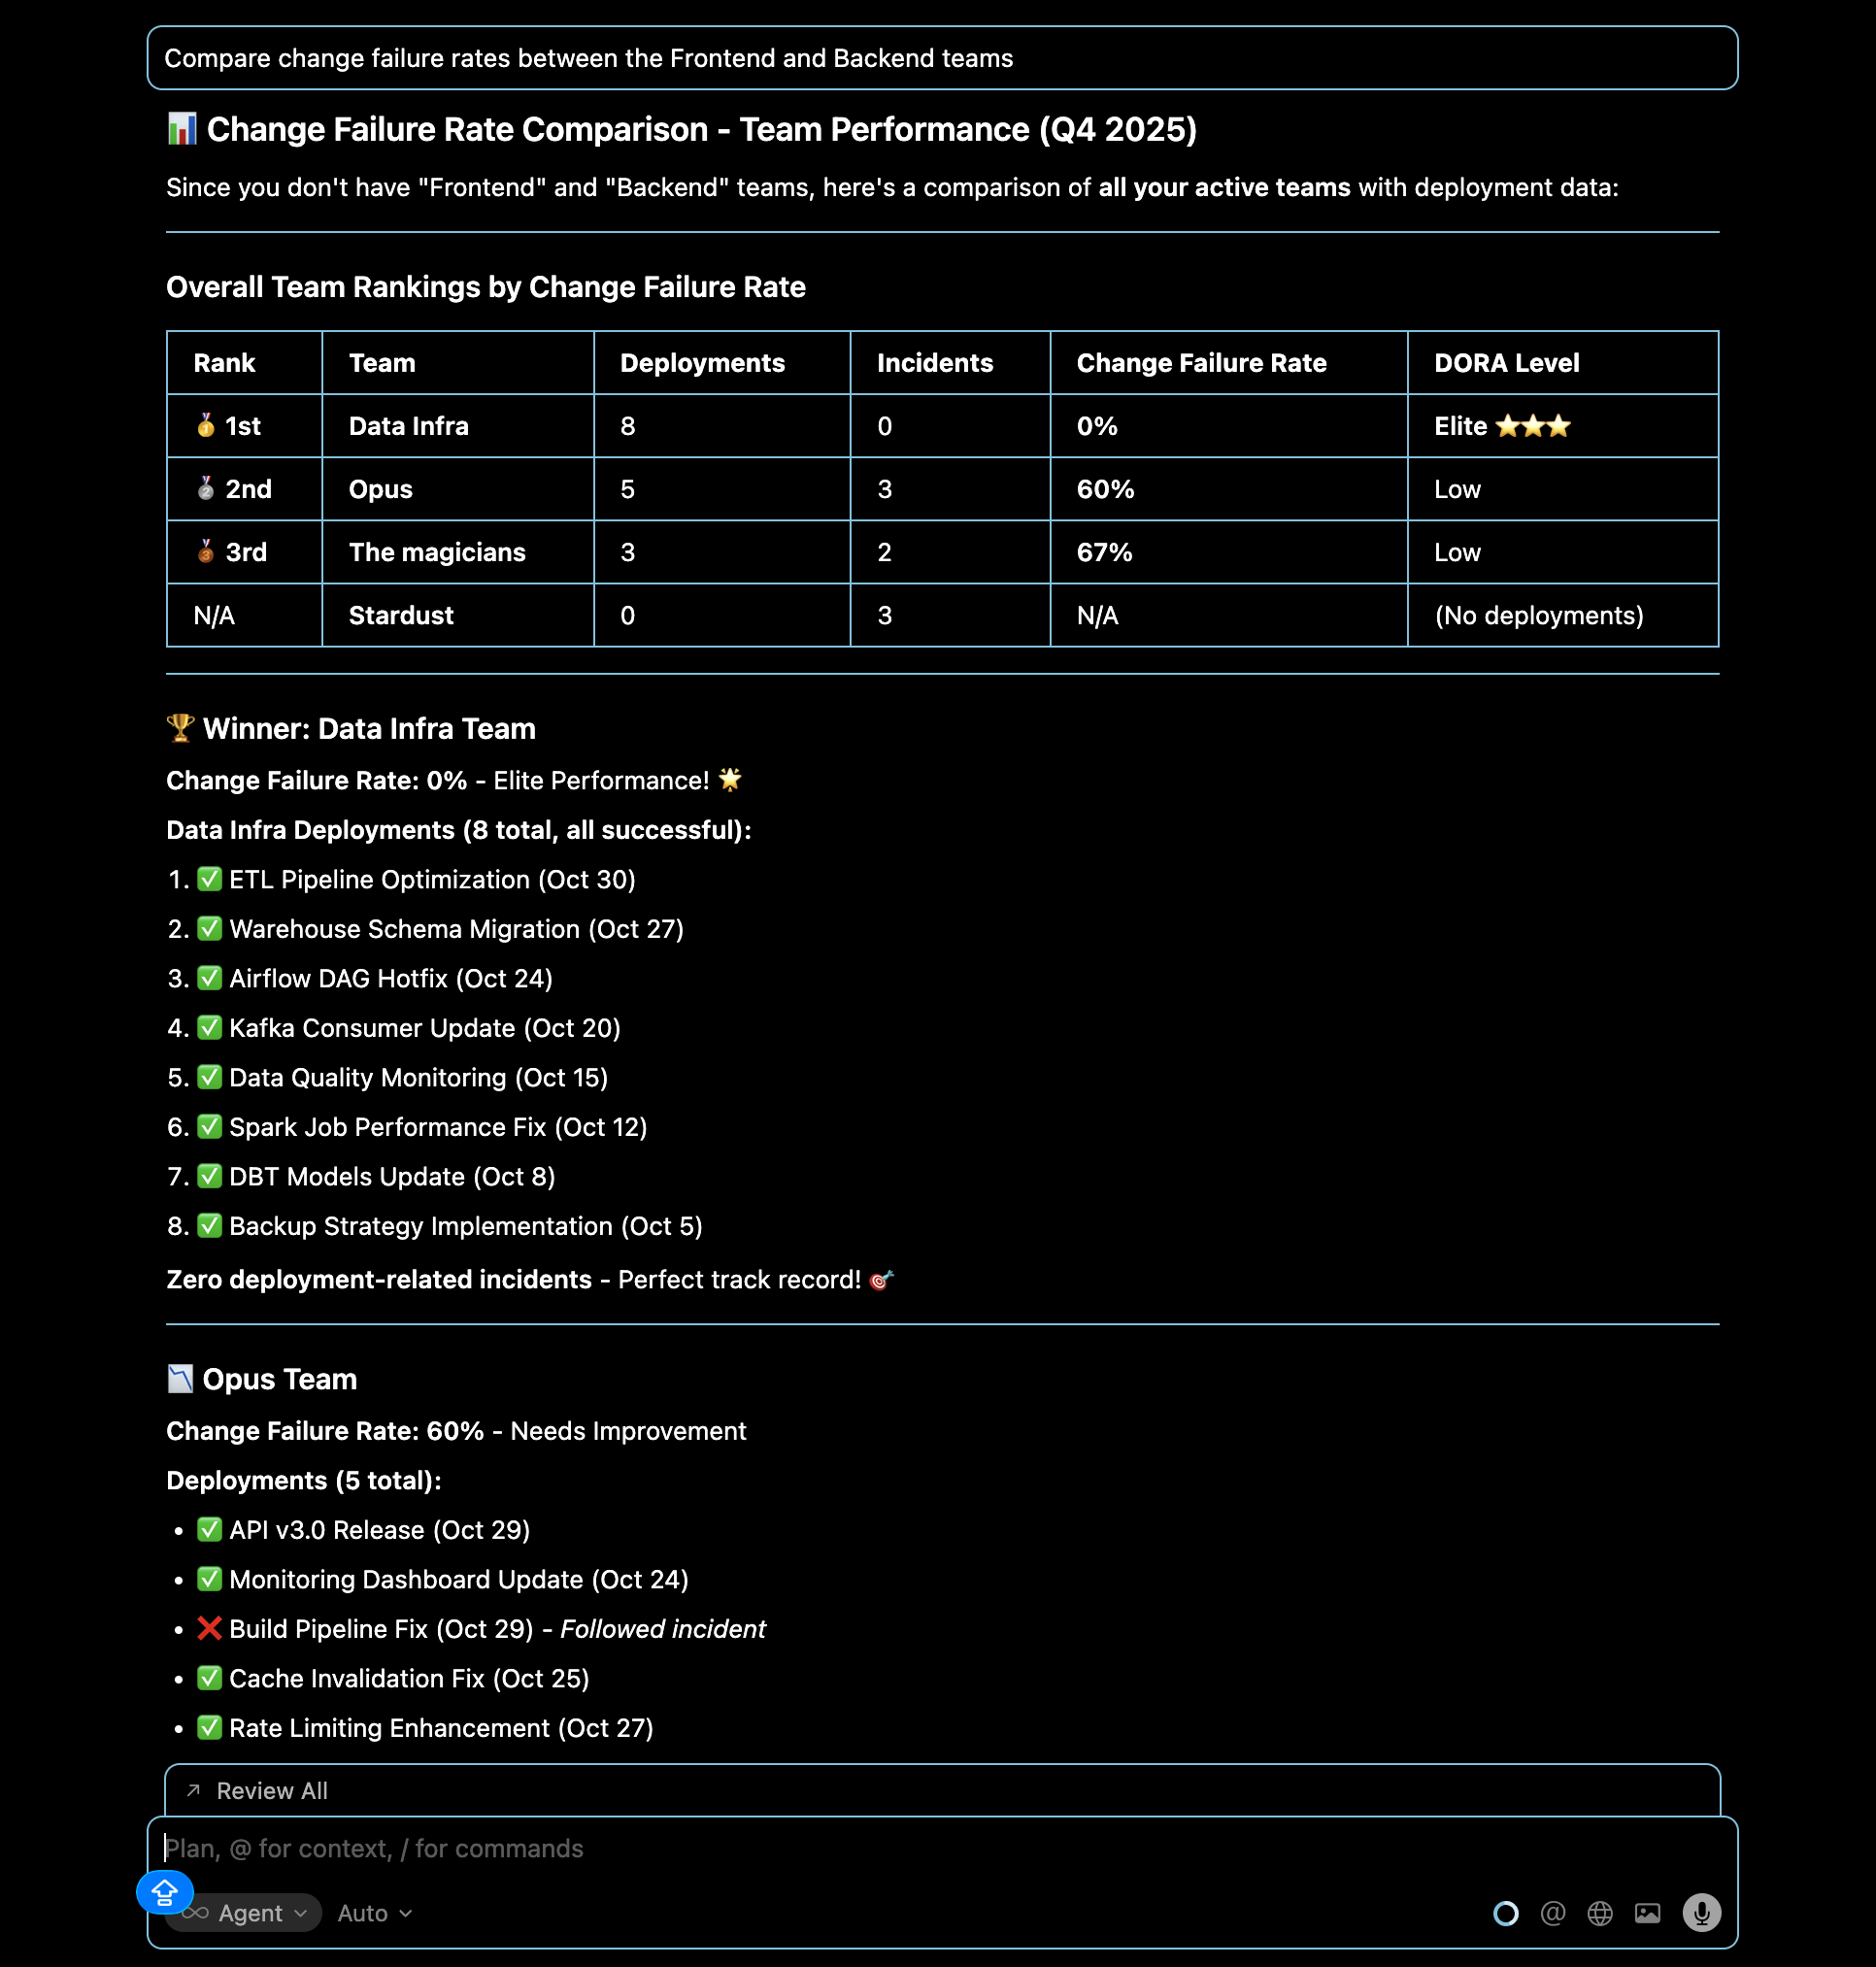
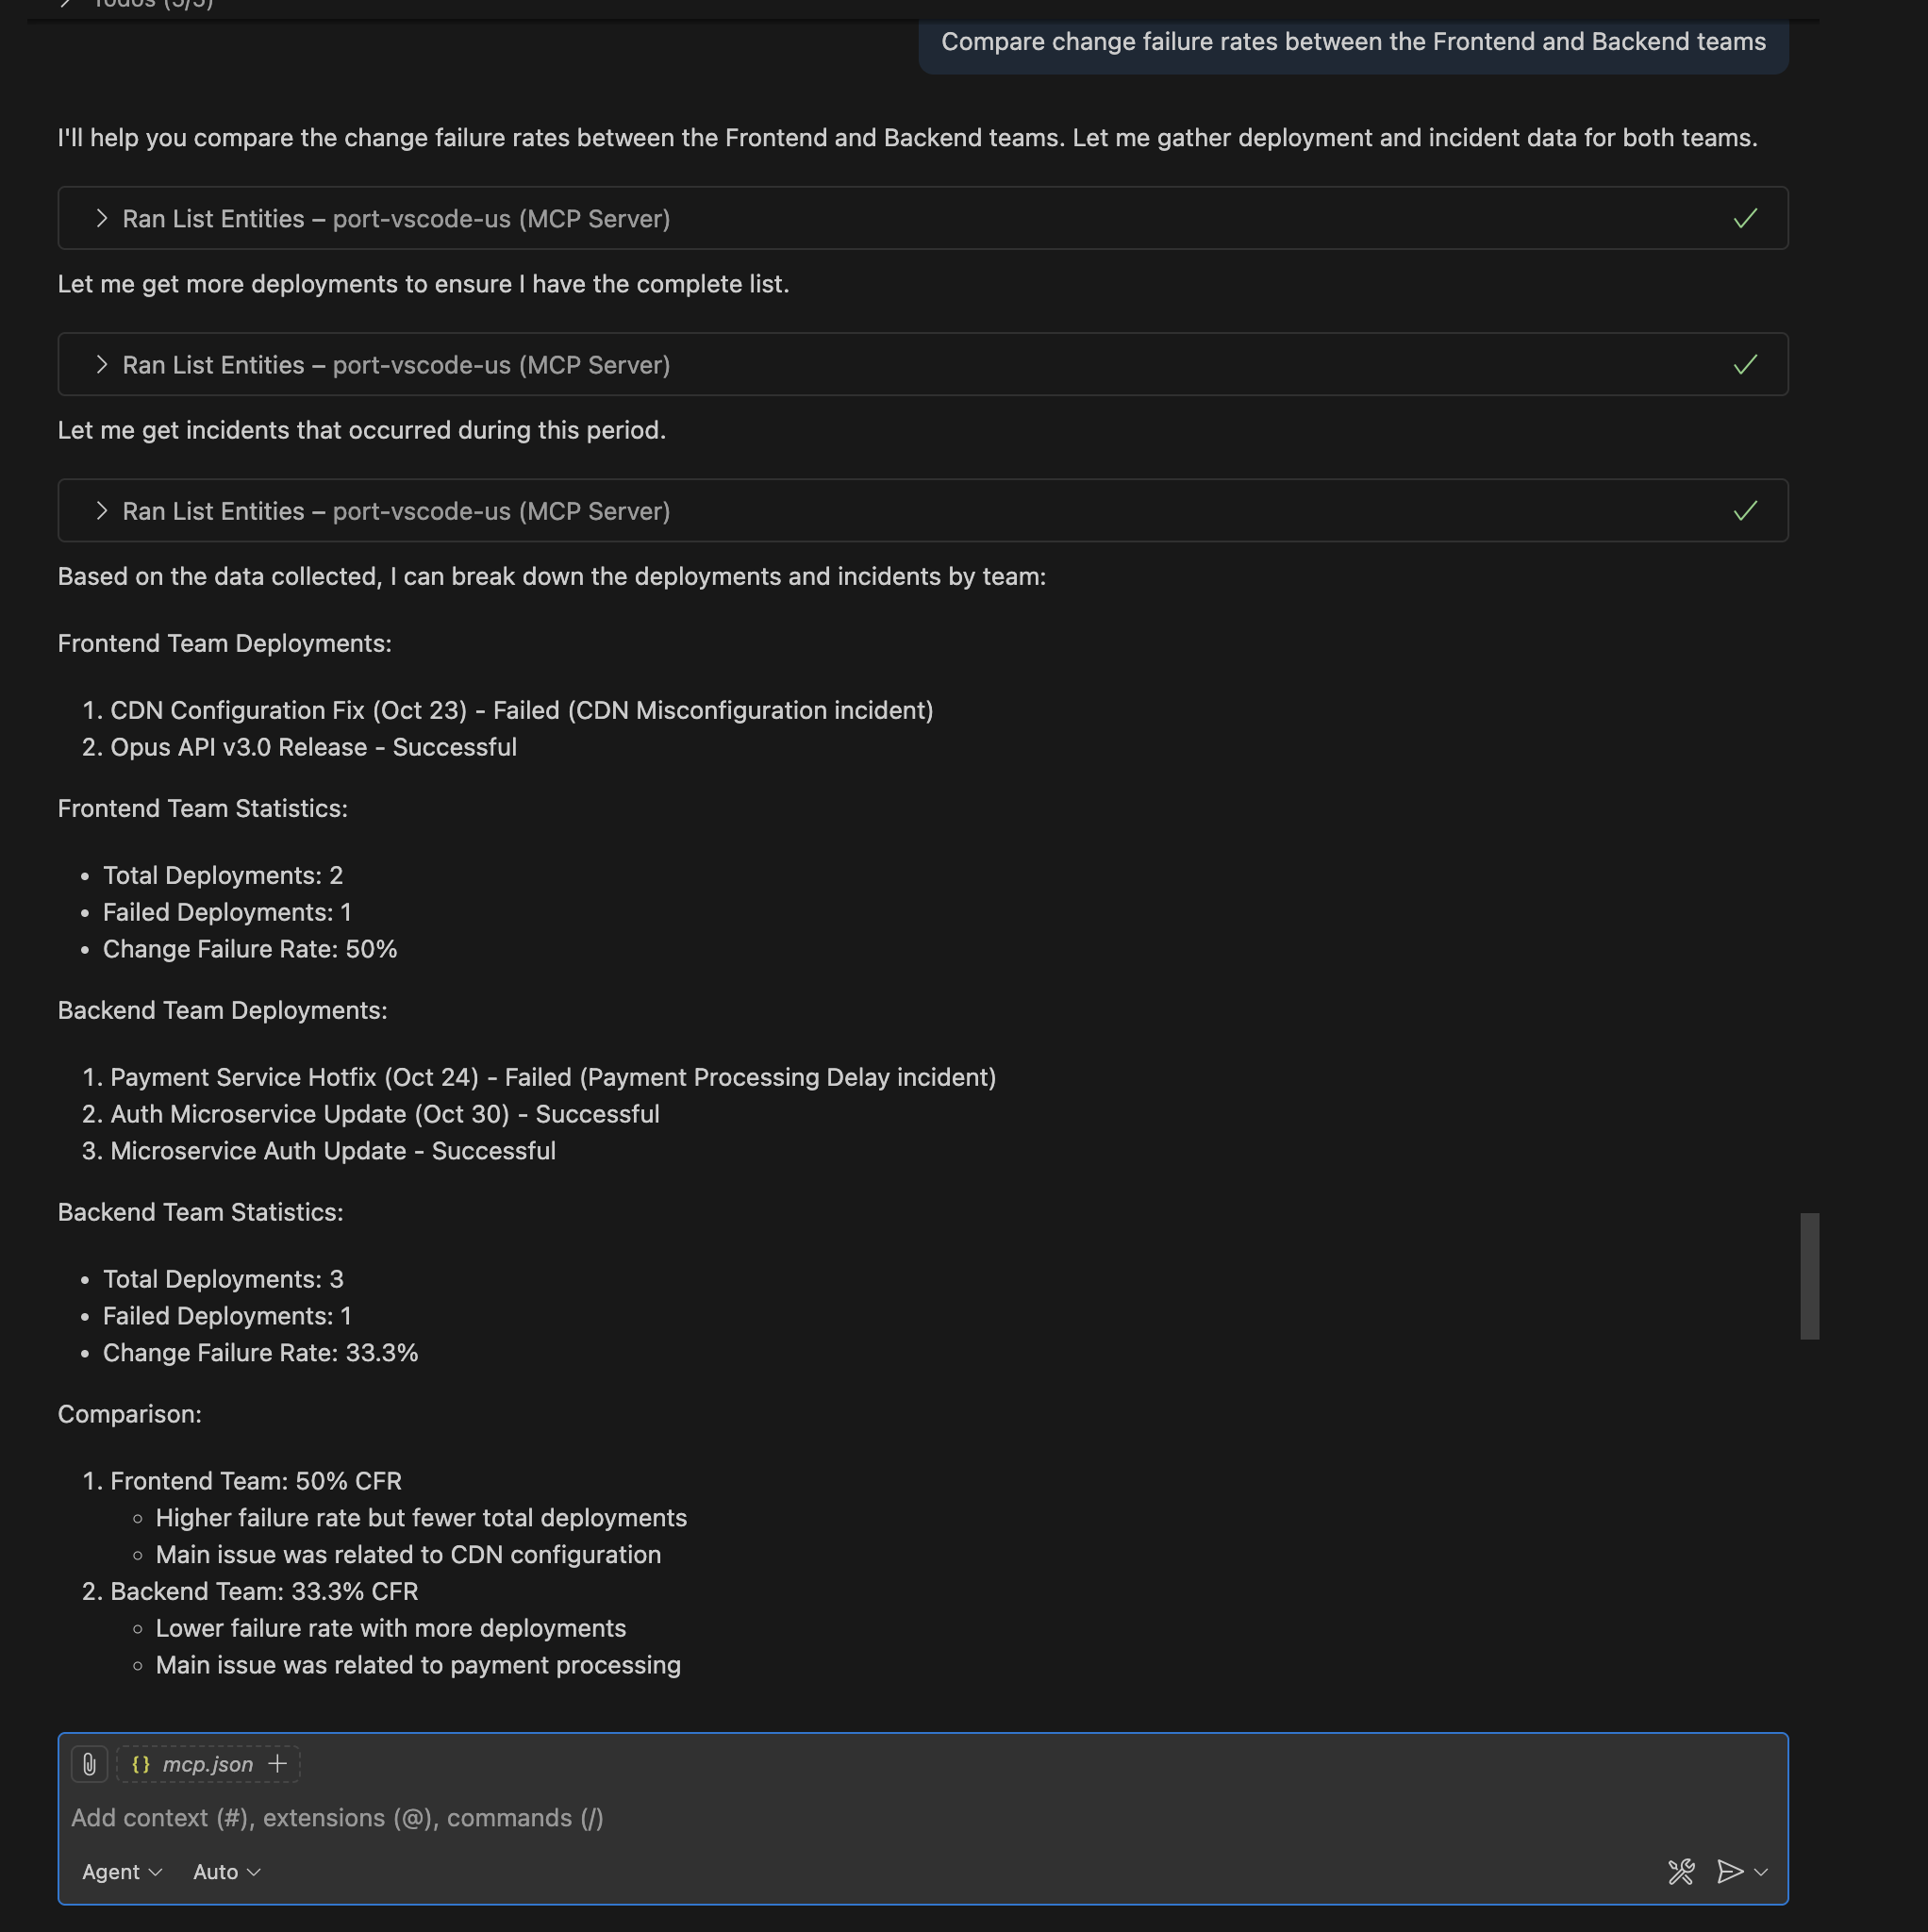
Query: "Compare change failure rates between the Frontend and Backend teams"
Identify teams that might need additional support or process improvements in their deployment practices.
- Cursor IDE
- VS Code
Lead time insights
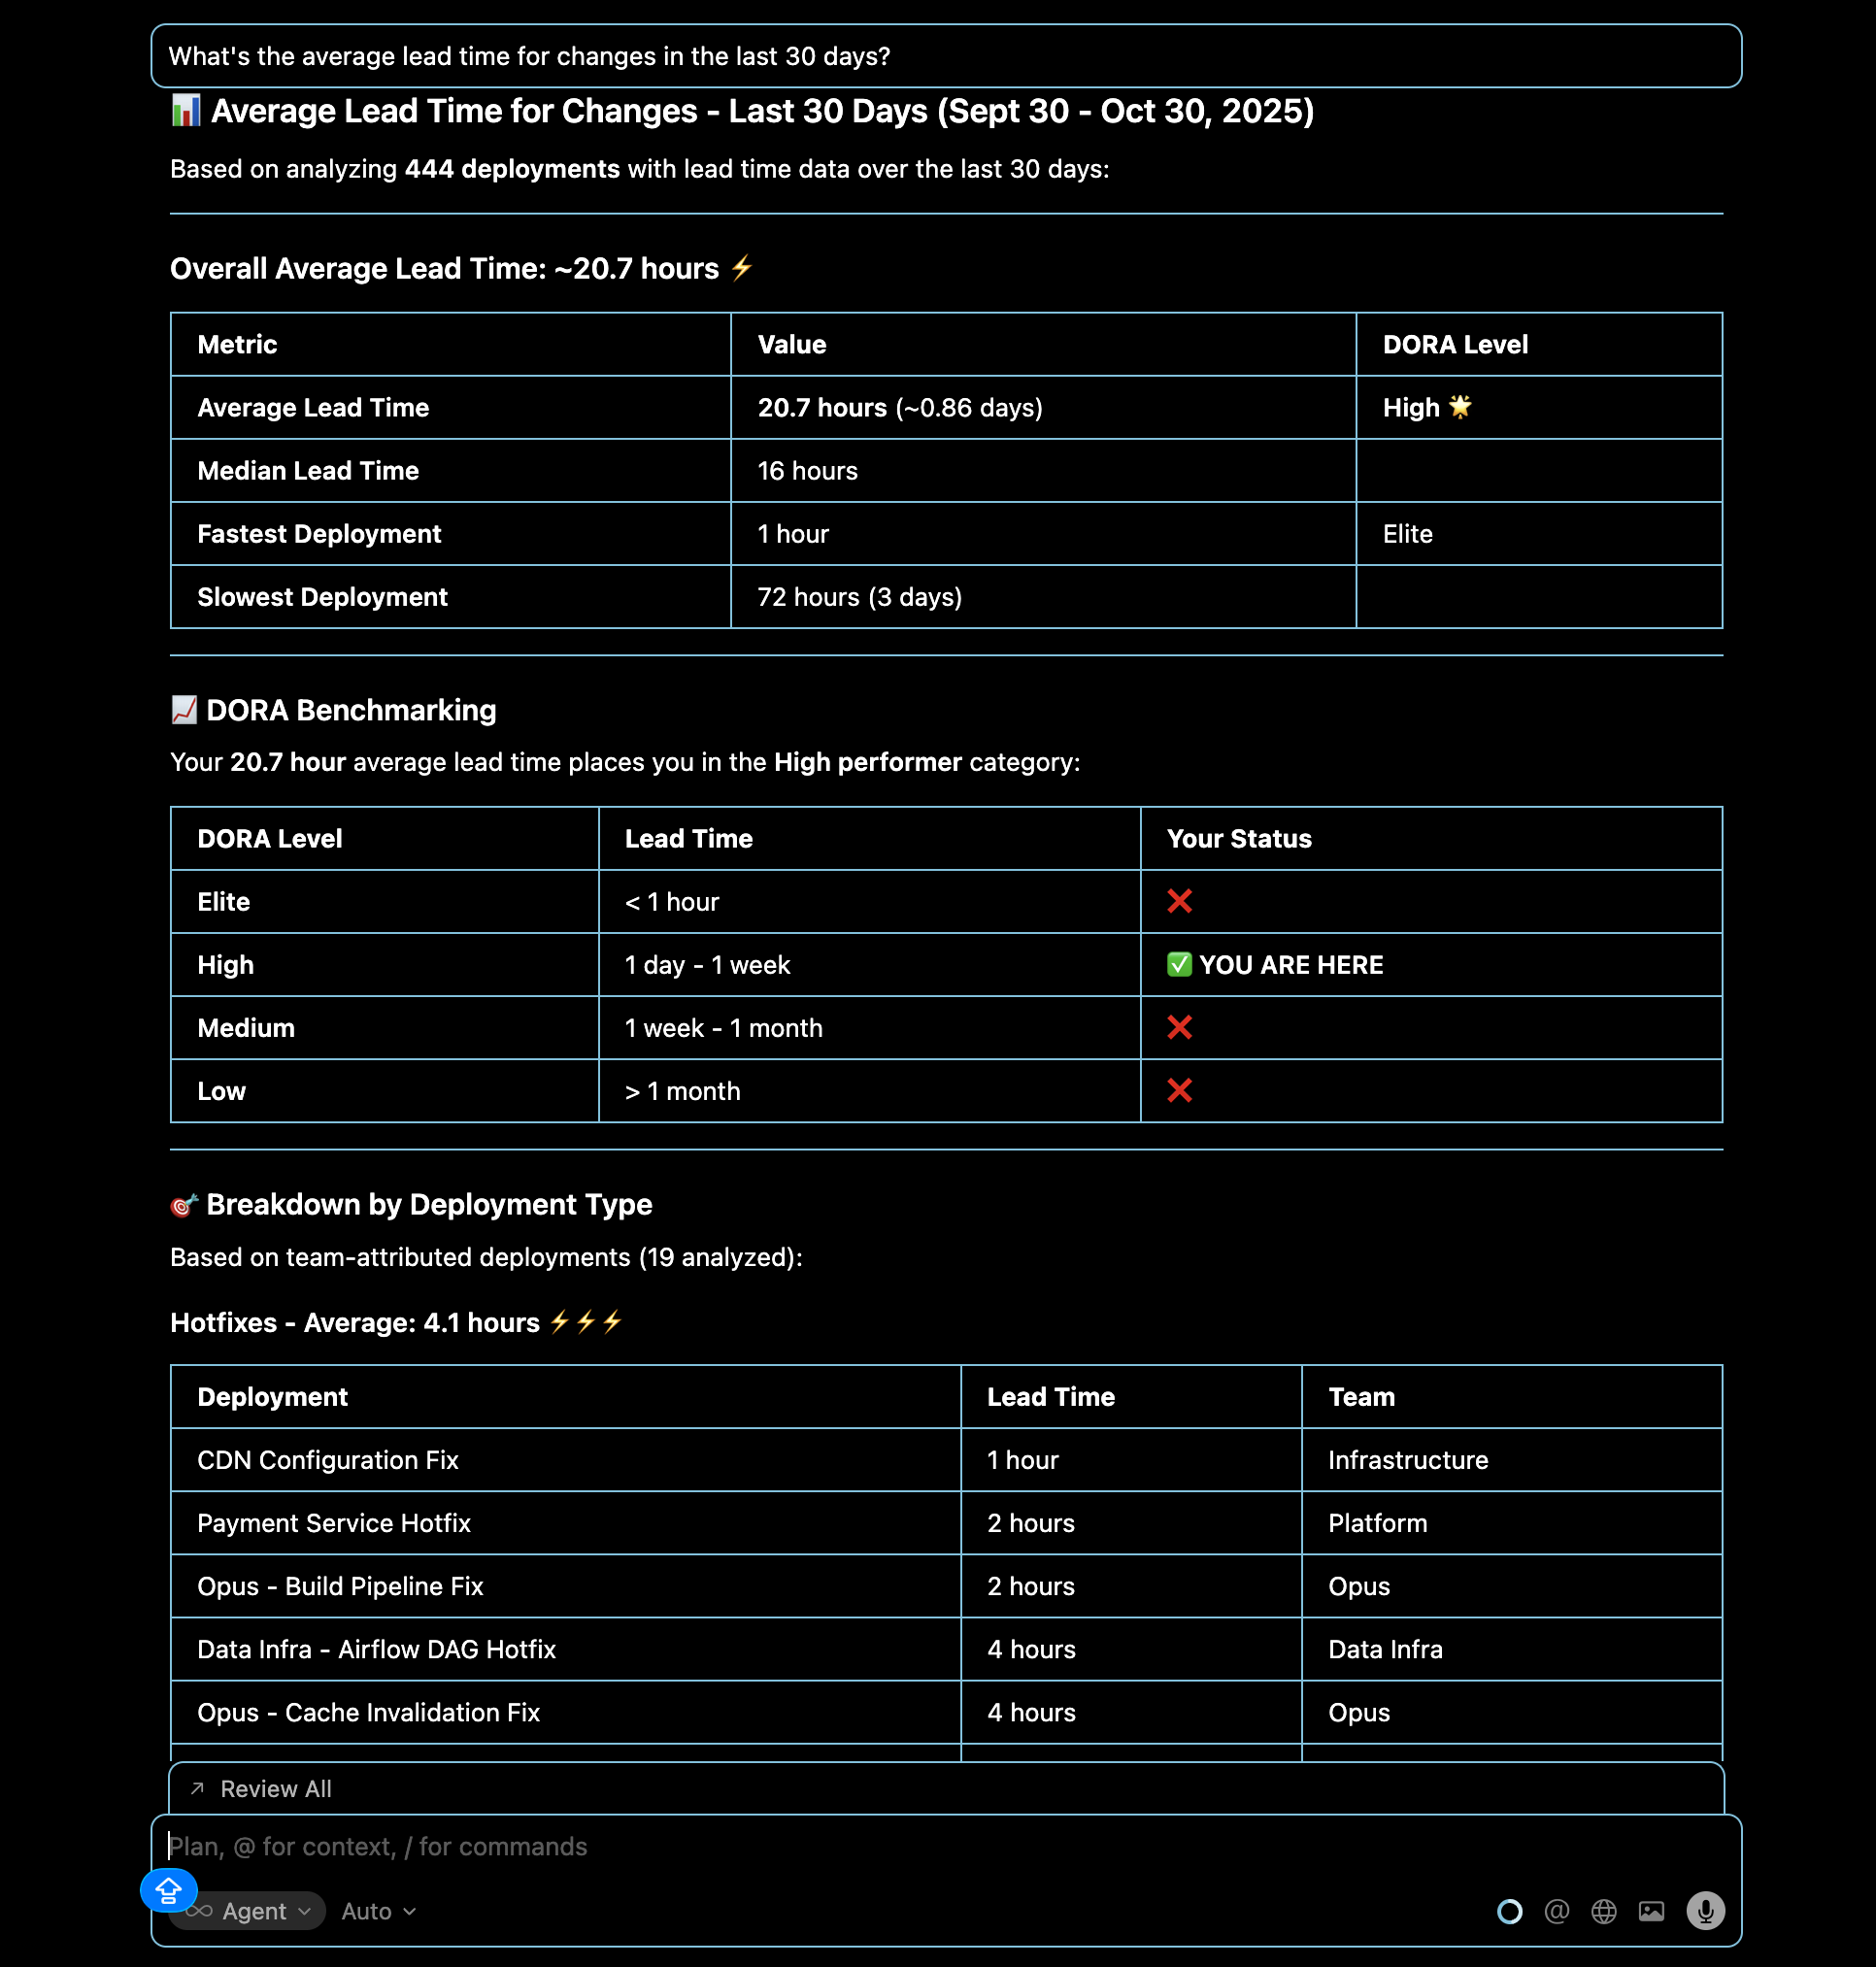
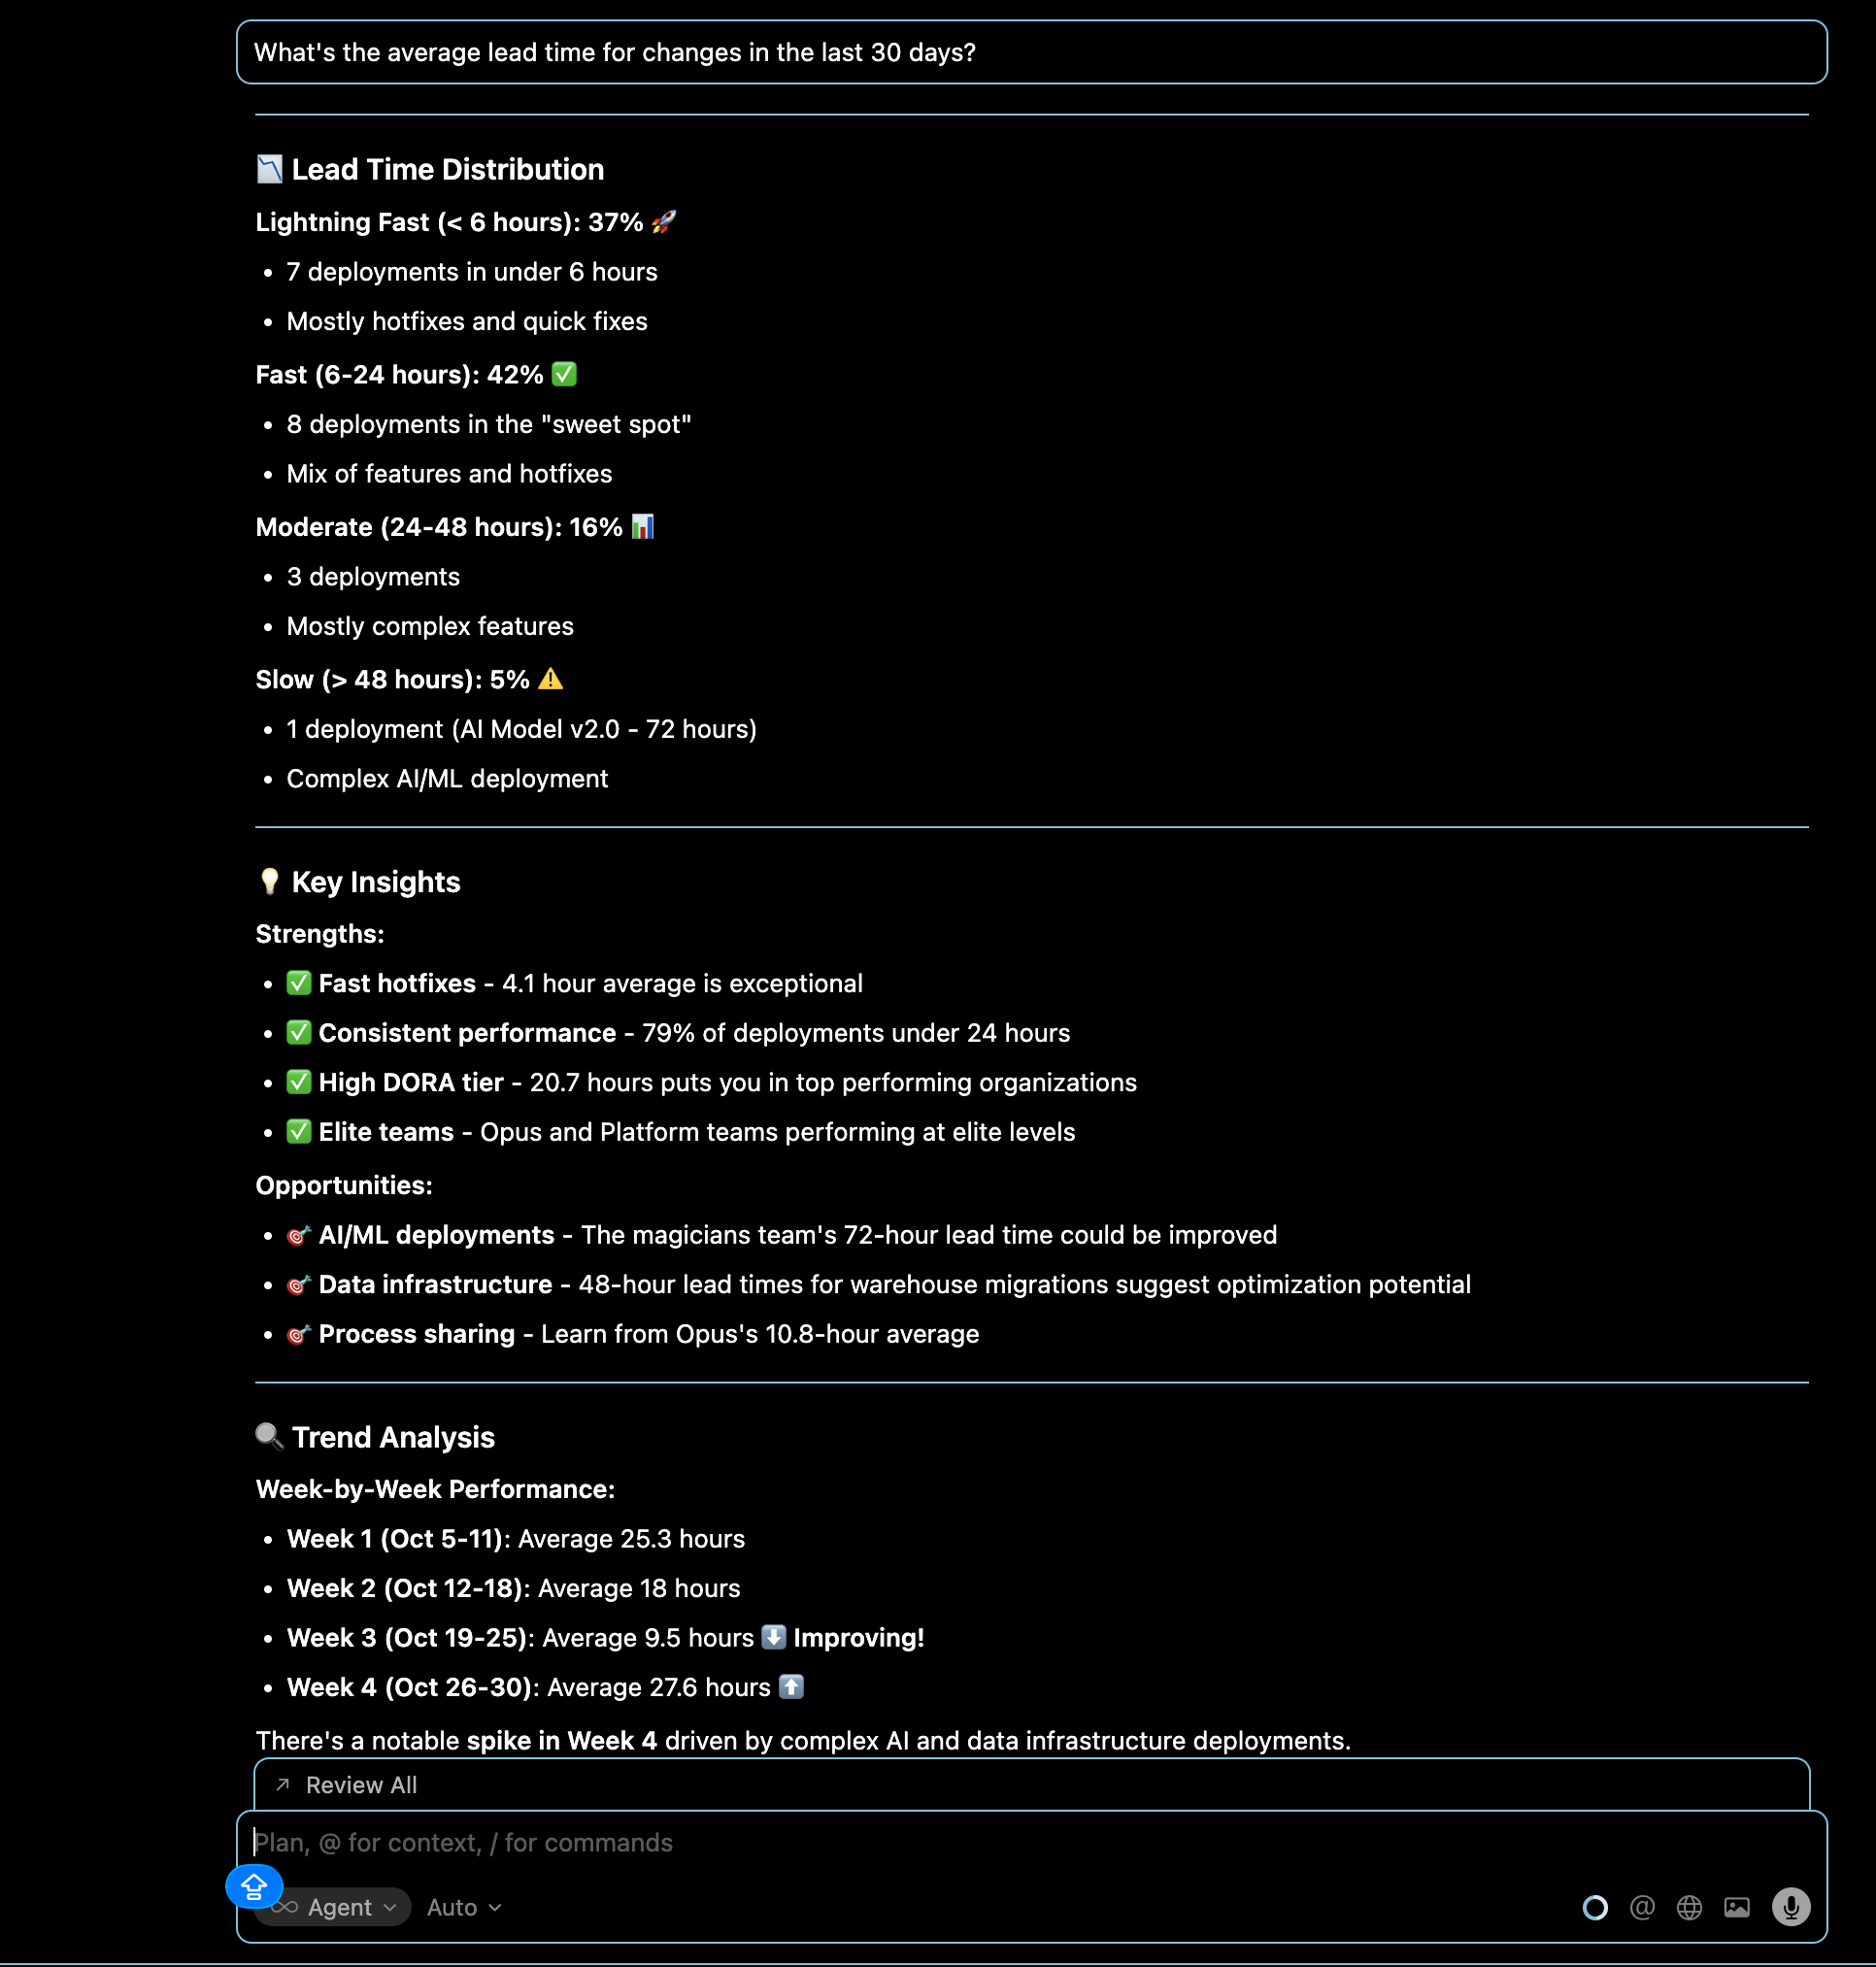
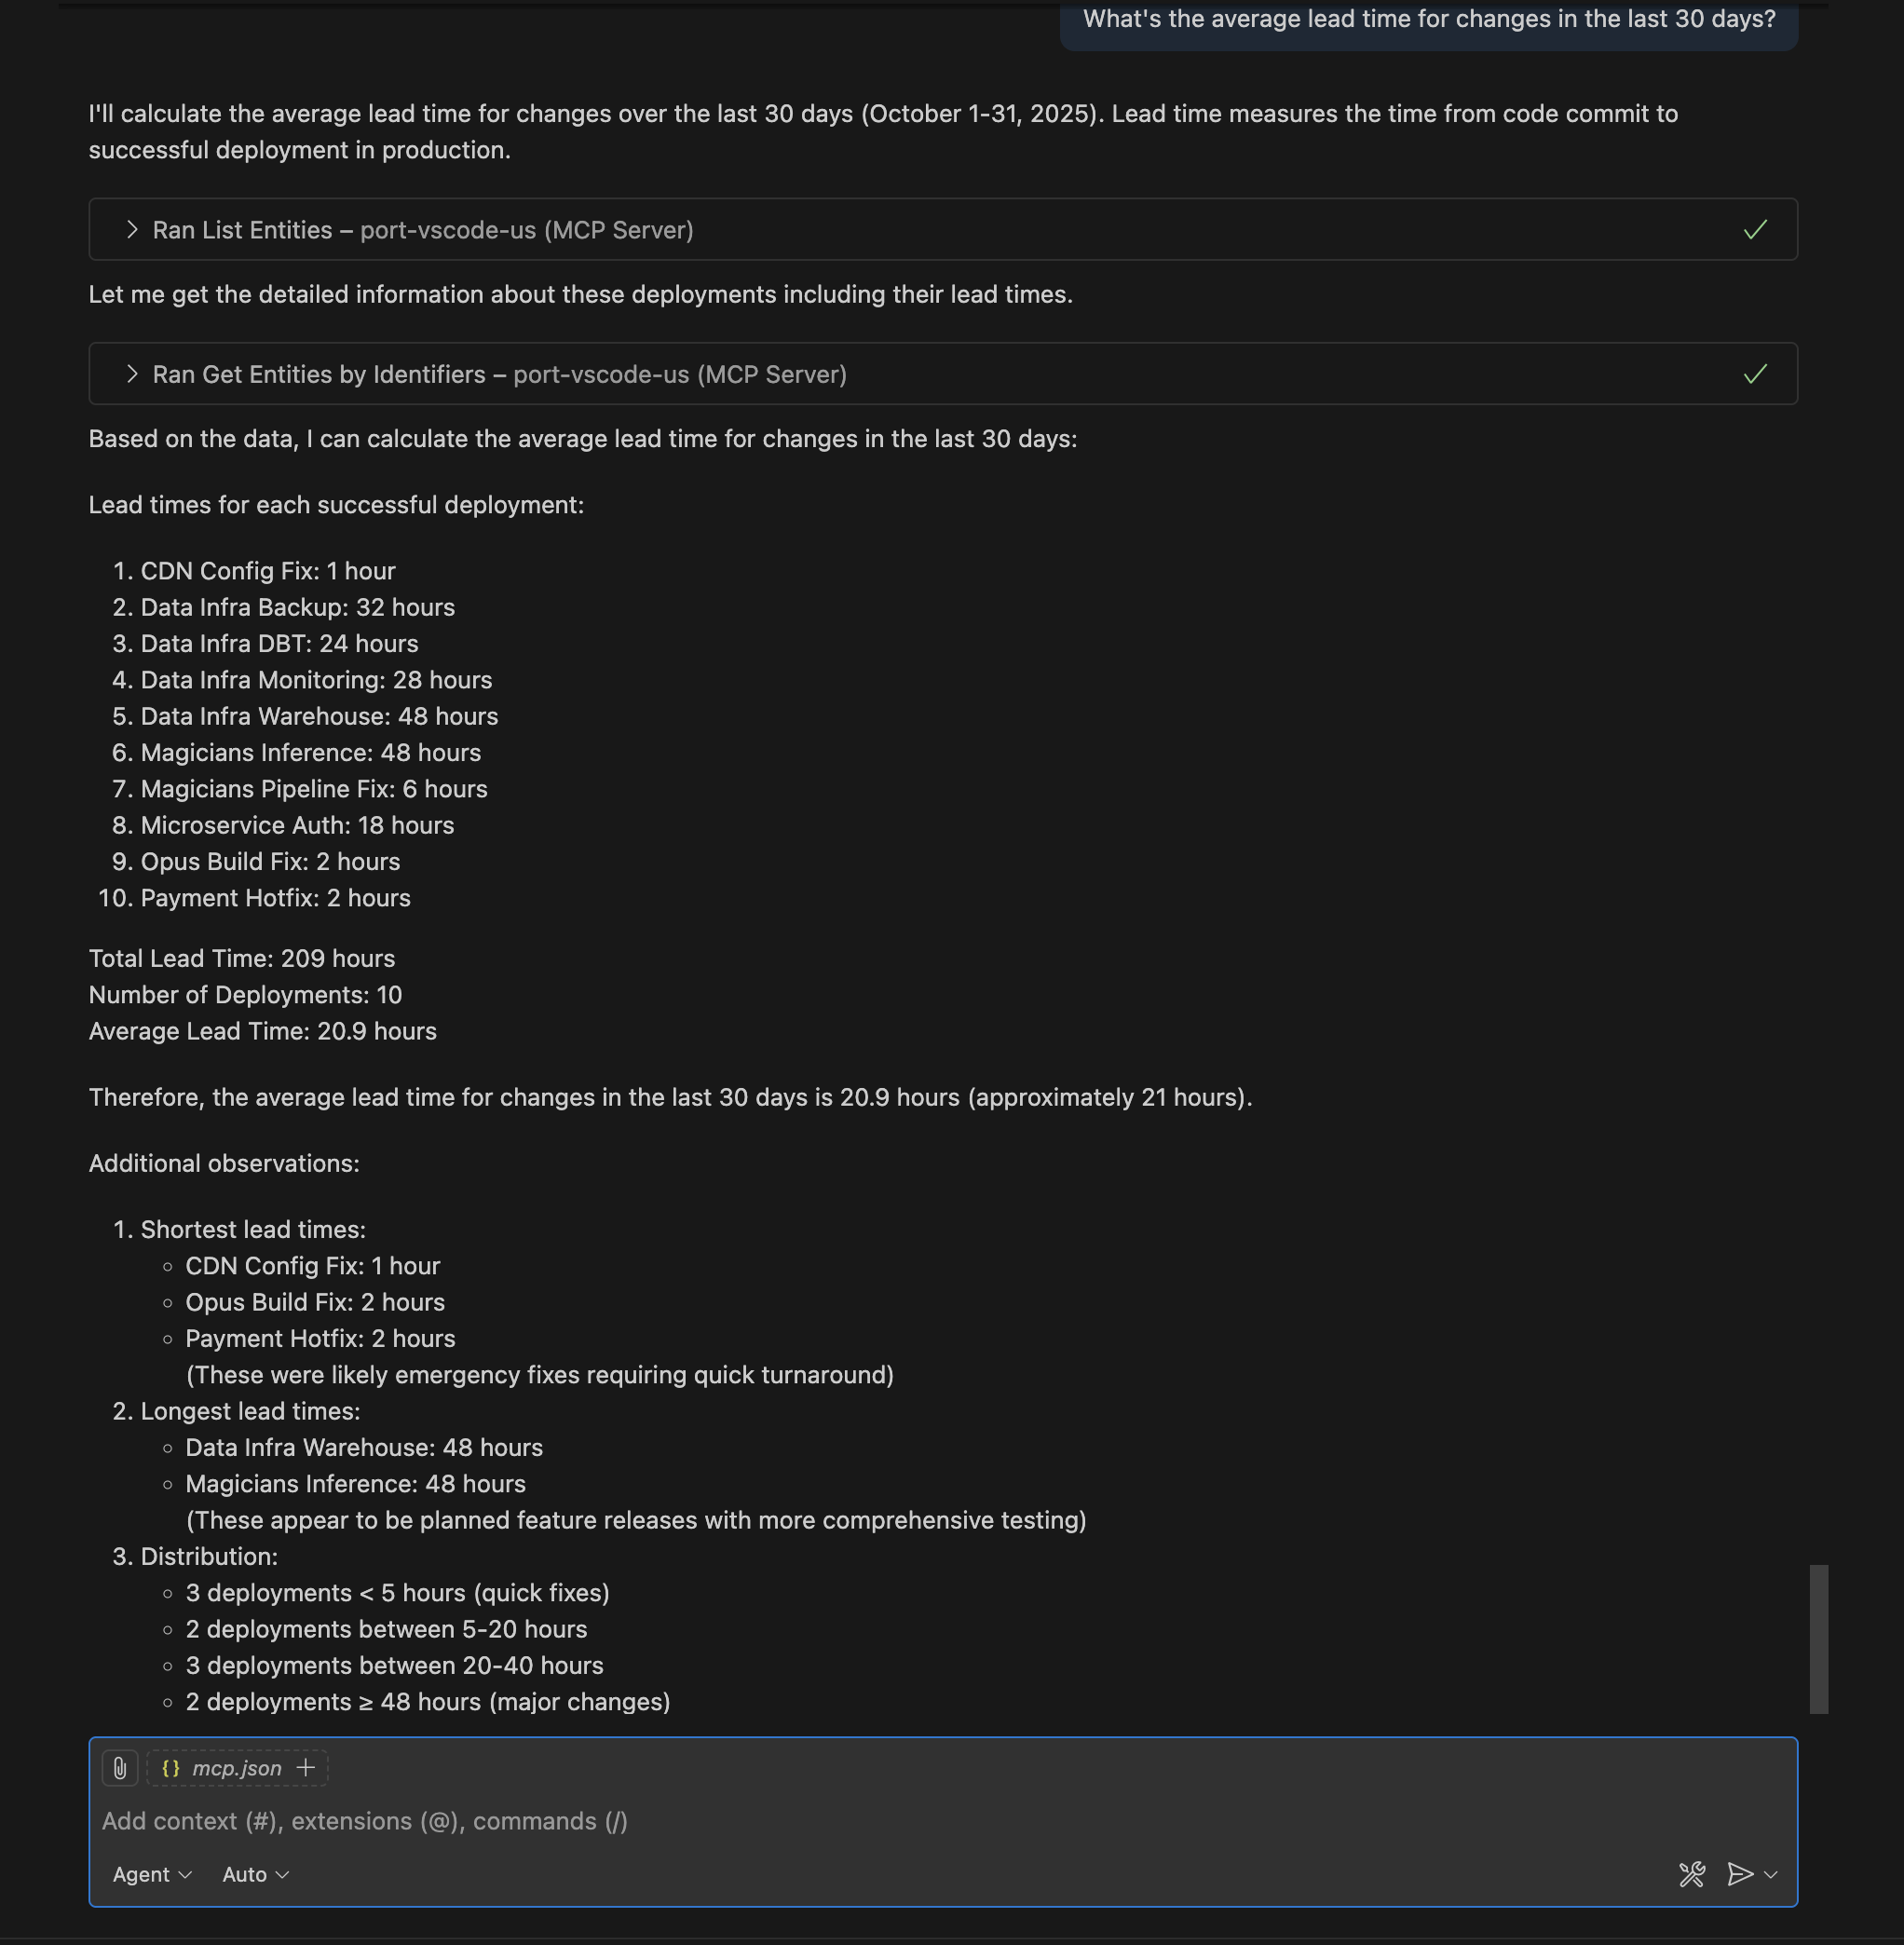
Query: "What's the average lead time for changes in the last 30 days?"
Get visibility into how long it takes to deliver code changes to production across your organization.
- Cursor IDE
- VS Code
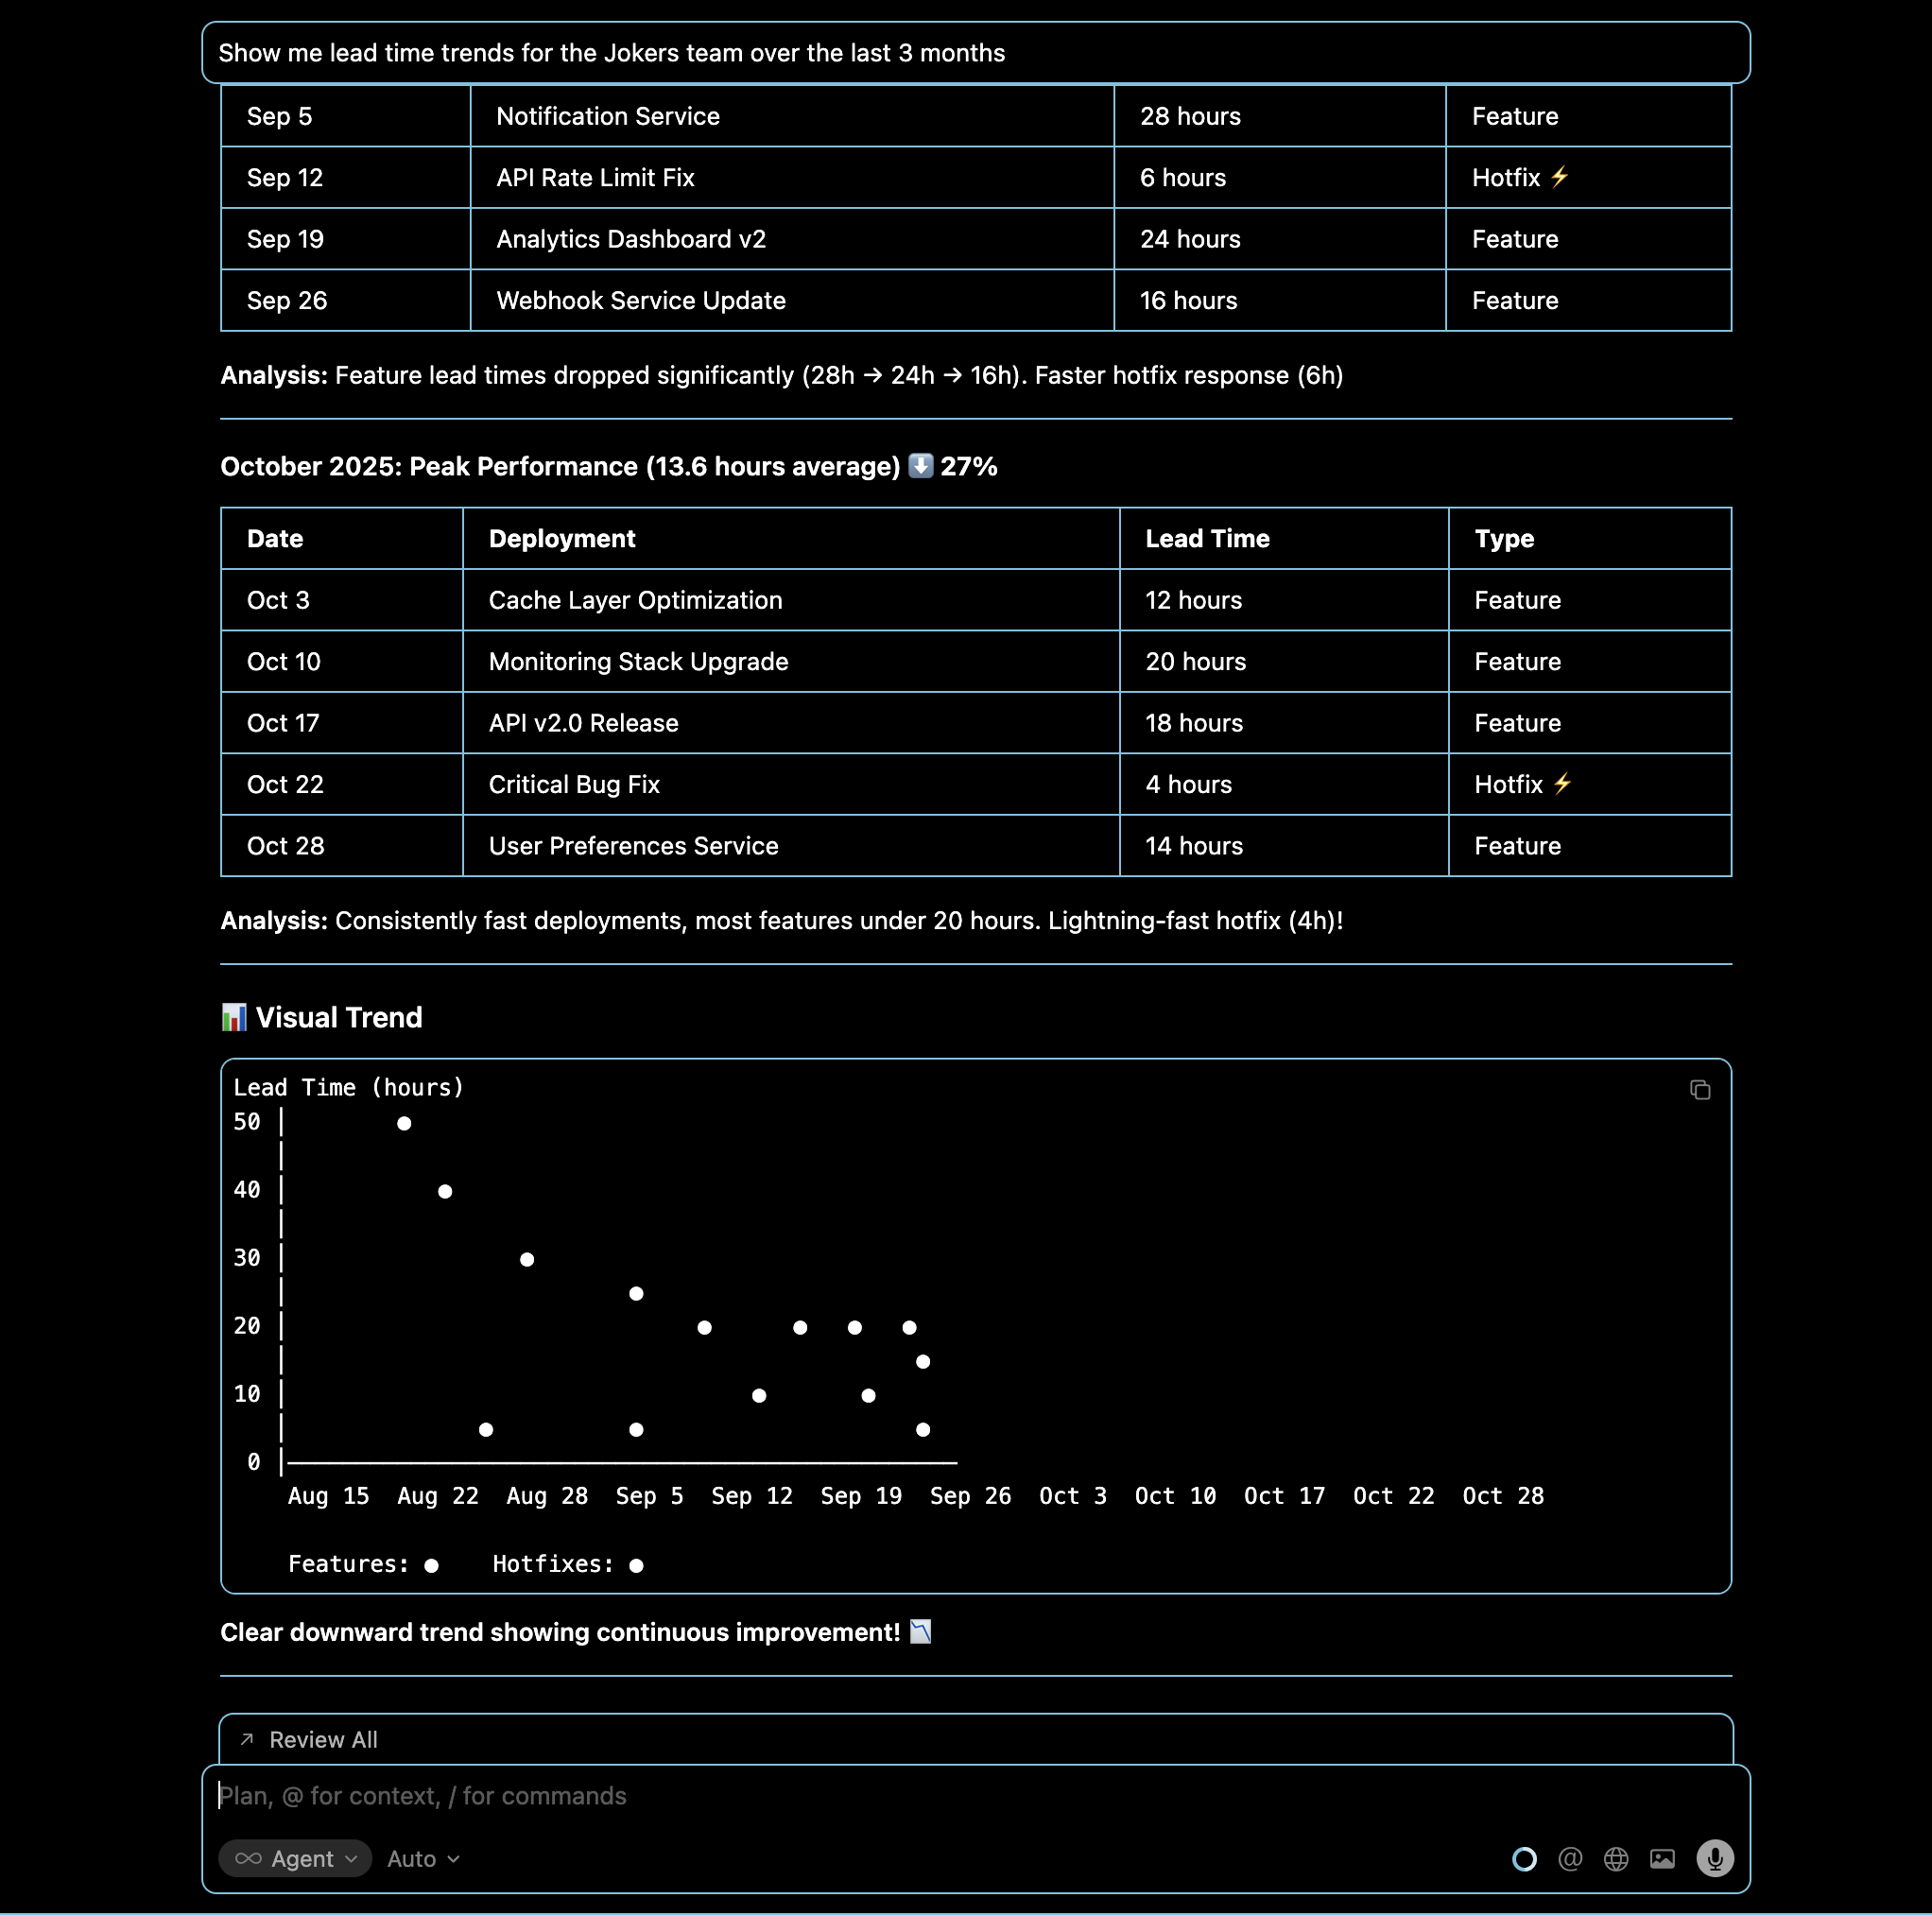
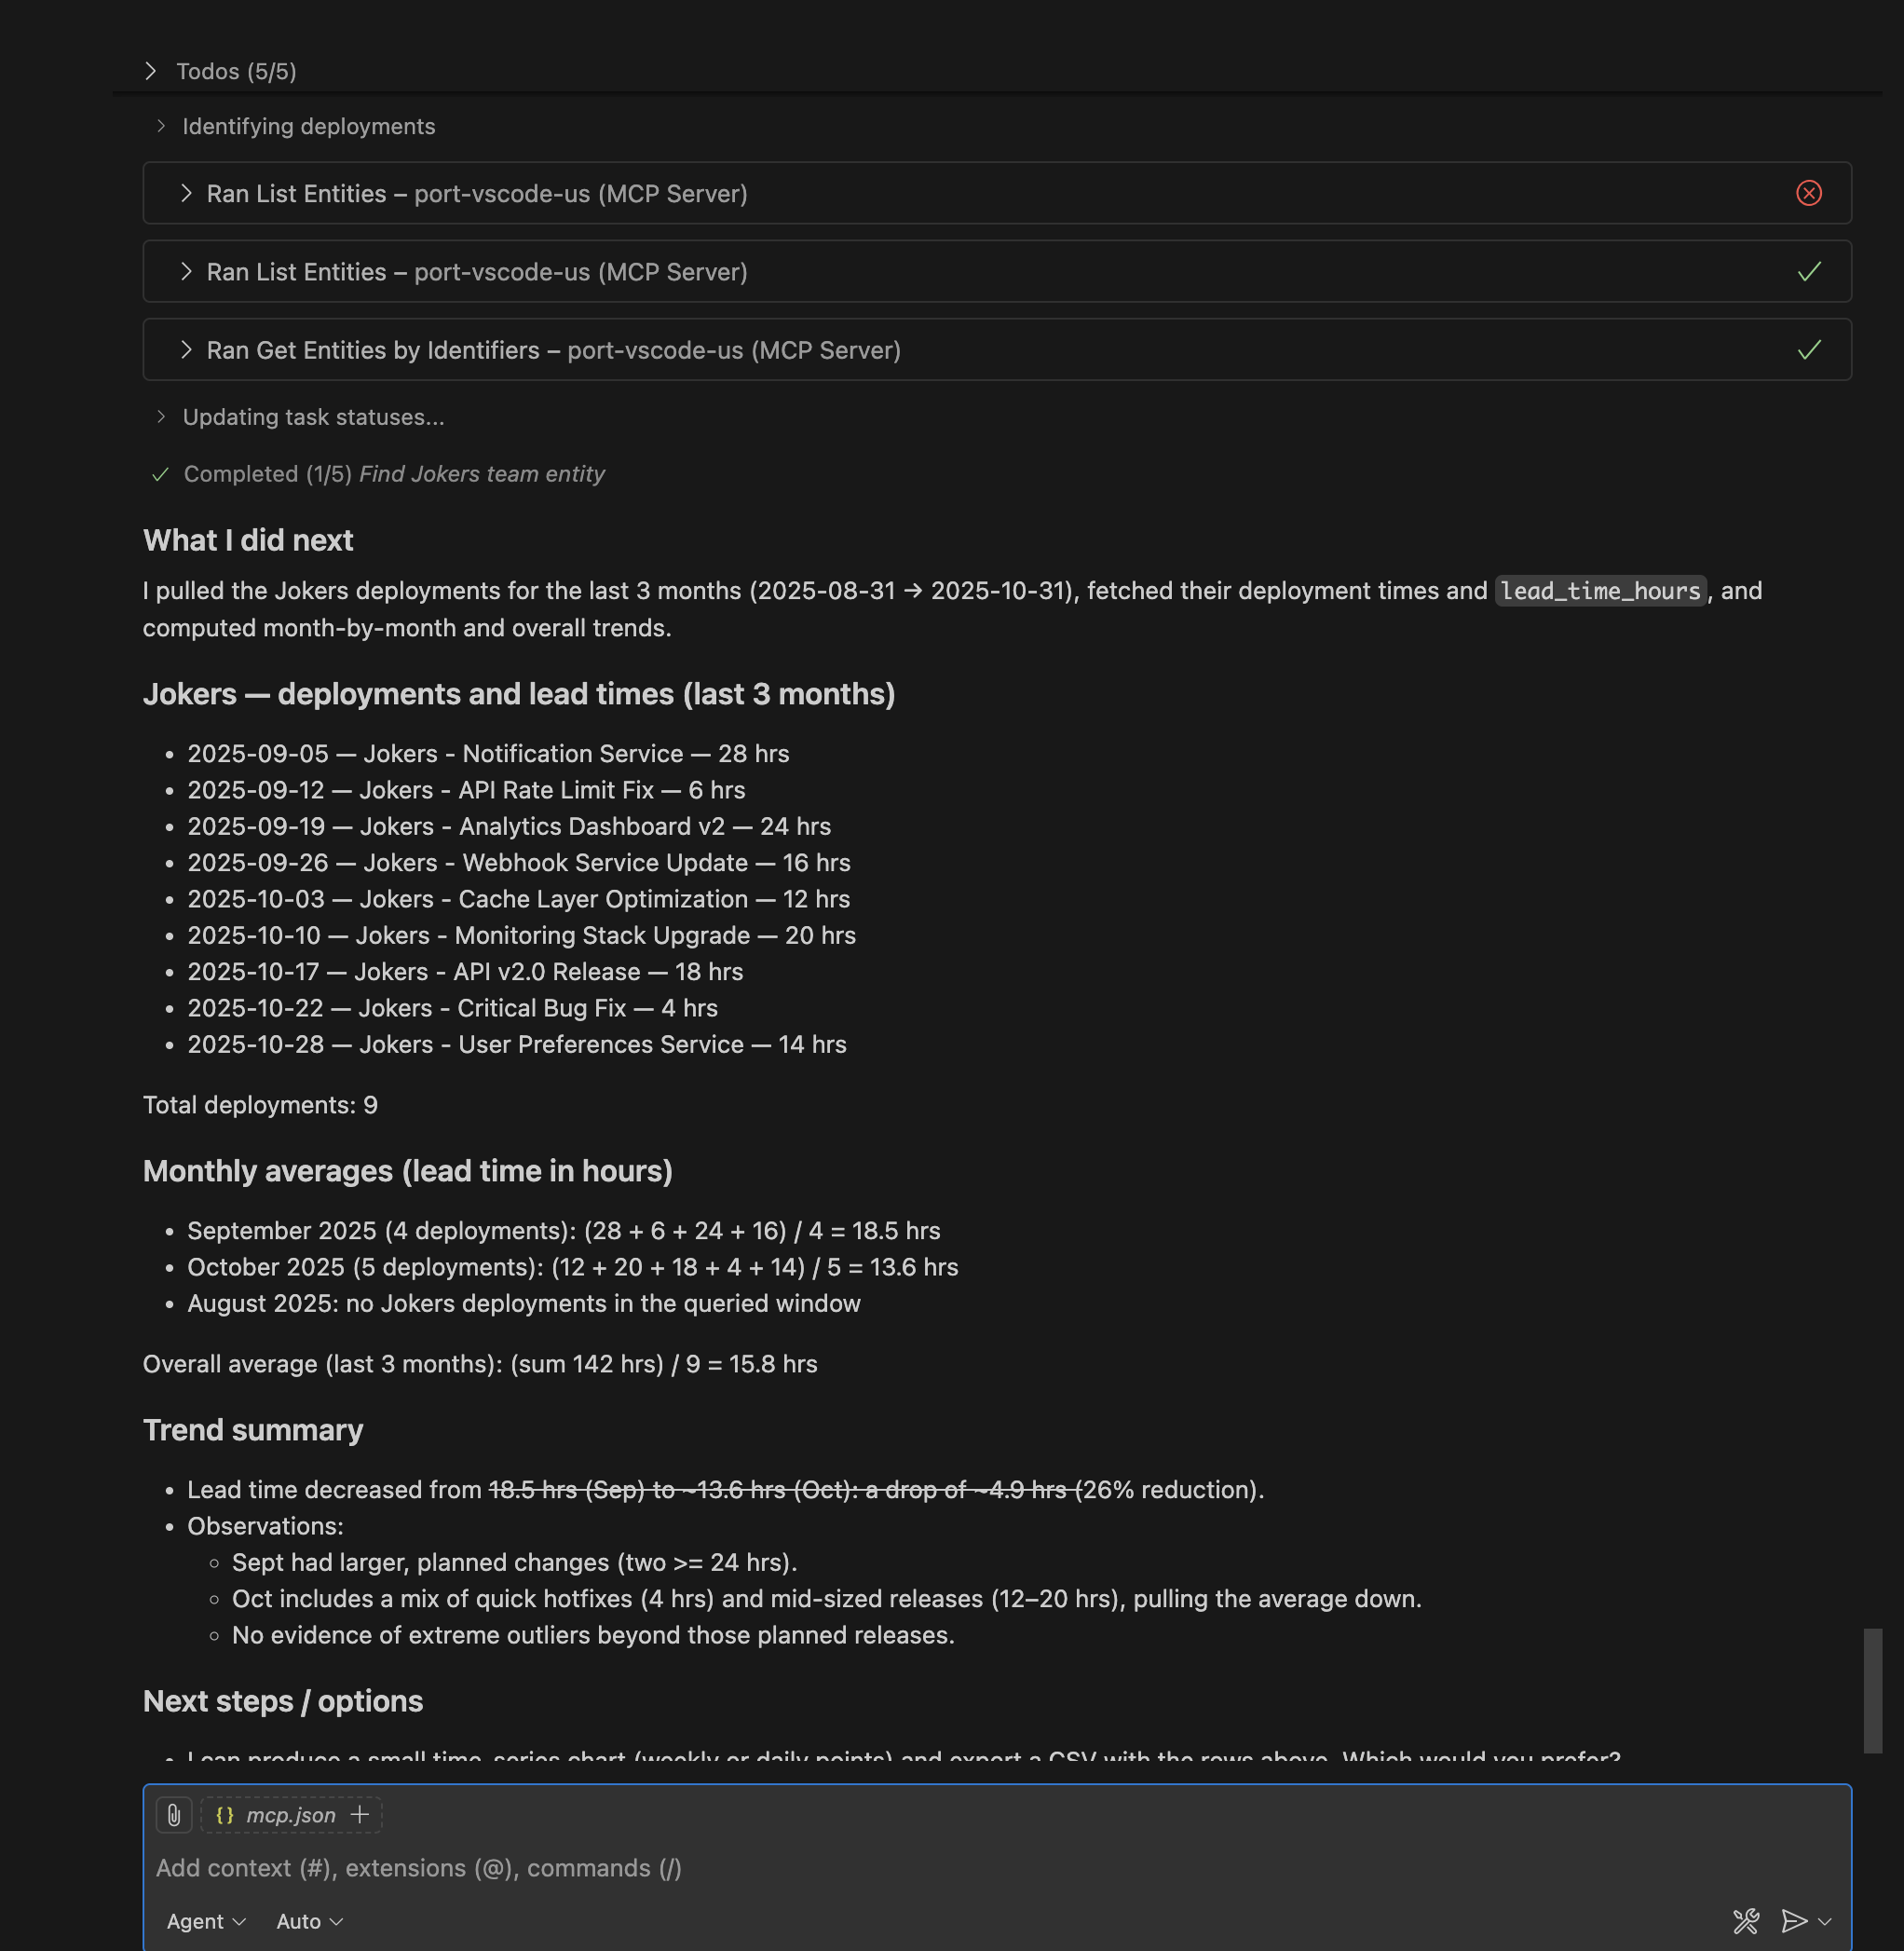
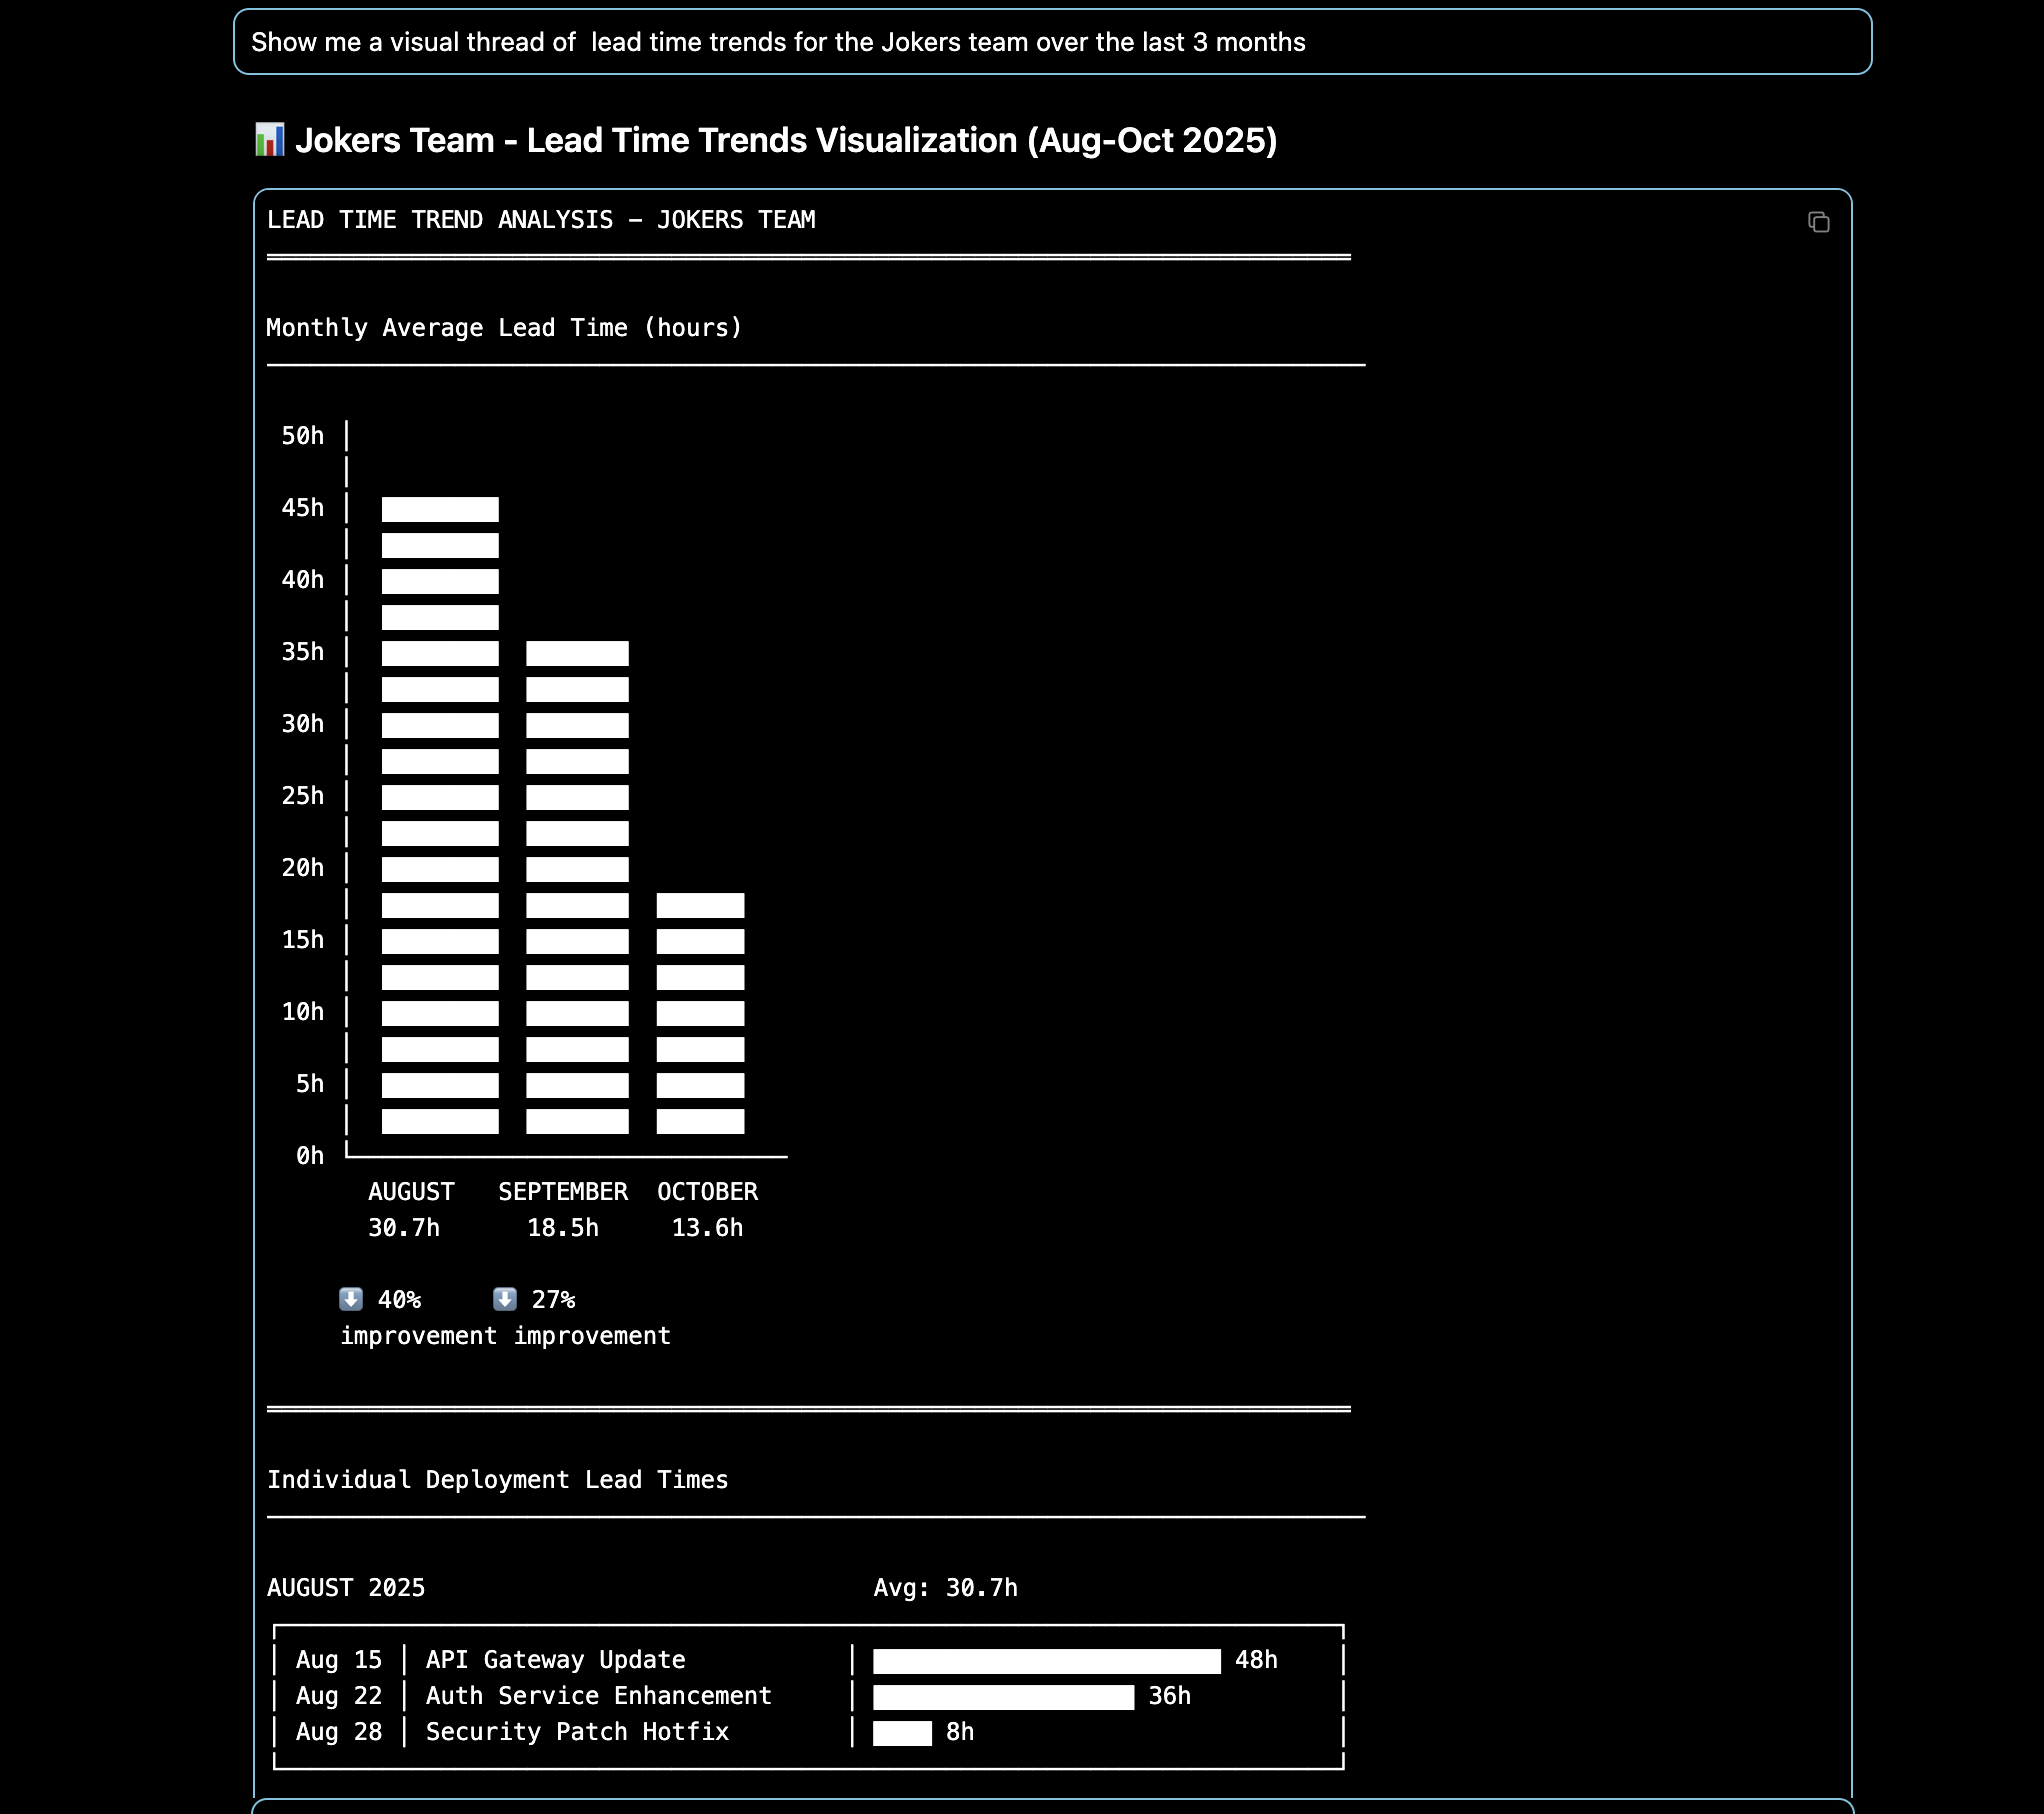
Query: "Show me lead time trends for the Jokers team over the last 3 months"
Track improvement or degradation in a team's delivery speed over time to identify process changes or bottlenecks.
- Cursor IDE
- VS Code
Advanced querying techniques
- Filters
- Trends
- Benchmarks
- Cross-Metrics
Time ranges and filtering:
- "Show me DORA metrics for services tagged as 'critical' in the last 30 days."
- "What's the deployment frequency for deployments owned by the Stardust team since last month?"
- "Show me all incidents with priority 'high' or 'critical' resolved in the last 30 days."
Trend analysis over time:
- "How has our overall change failure rate changed over the last 6 months?"
- "Show me the deployment frequency trend for the Opus team over the last quarter."
- "Has the Data Infra team's lead time improved since last month?"
Performance comparisons:
- "How do our DORA metrics compare to industry benchmarks?"
- "Which teams are performing above/below the organization average for each DORA metric?"
- "Show me services that meet the 'Elite' DORA performance criteria."
Multi-metric analysis:
- "Which services have both high deployment frequency and low change failure rate?"
- "Show me teams with MTTR above 4 hours in the last month."
- "Identify teams that might need help with incident response processes."
Understanding the responses
The MCP server responses rely on Port's data model, using the available MCP tools to access and analyze your data. You can:
Get detailed insights and take action
- Ask your LLM to explain the results and provide context.
- Request actionable recommendations like "how can we improve the lead time?"
- Take follow-up actions directly through the MCP server.
Dive deeper into results
- Drill down into specific metrics with follow-up questions.
- Cross-reference DORA metrics with other Port data like service health or scorecards.
- Explore different time periods or team comparisons.
Request custom visualizations
- Ask to show results in a graph or chart format.
- Request to create a custom web application to visualize the data (Claude Artifacts is excellent for this).
- Generate executive-ready dashboards and reports.
To get the most accurate and useful responses:
- Be specific about time ranges (e.g., "last 30 days" instead of "recently").
- Specify teams, services, or environments when relevant.
- Ask follow-up questions to drill down into interesting data points.
- Use the MCP server's ability to cross-reference with other Port data like scorecards and service health.
Next steps
Now that you can query DORA metrics using Port MCP, consider these recommendations:
- Enrich and deepen your DORA data model: Enhance your Port data model with additional deployment and incident sources for faster results and comprehensive dashboards implementation.
- Find areas for improvement: Use the insights gained to identify specific teams, services, or processes that need attention.
- Automate reporting: Use the MCP server in an automated way to produce executive reports or weekly team performance summaries.
- Set up alerts: Configure Port automations to notify teams when DORA metrics cross certain thresholds.
- Expand analysis: Combine DORA metrics with other Port data like service health, scorecards, and dependencies.
Related guides
- Create & track DORA metrics in your portal
- Set up DORA metrics using GitLab
- Set up DORA metrics using Jira
- Port MCP server overview & installation
- Available MCP tools